There is a common question that modern basketball hasn't found an answer to yet: Should you play fast or should you play smart?
I've analysed data from the past few seasons in the Euroleague regular season using Hudl Instat shot chart data. I mapped 14 shooting zones across all 18 teams, calculated eFG% for each zone, and broke down the numbers by play type — overall, in transition, and in half-court sets. The results don't always line up with what you'd expect if you've been following the analytics conversation over the past decade.
This is the first of two articles. Here, I'll lay out the data. In the second, I'll bring the film: real game footage showing what these numbers look like on the court.
Analytics entered the chat
Even though it sounds like a false dilemma, analytics has become a tool that can help coaching staff tackle that question with more tangible inputs than "feel".
We definitely see the implications in how a team is built, which shots they look for and how they prepare matches. Pace is not a neutral variable any more, it has become a philosophy.
Decades ago, the answer was pretty intuitive. Fast teams scored more points because they had more possessions. That was before starting to use possessions as the way to measure efficiency, with offensive/defensive rating as a popular and easy-to-understand metric by normalising to 100 possessions and beginning the era of comparing apples with apples.
In 2004, Dean Oliver established a new framework with his Basketball on Paper and the Four Factors that quantified success:
Shooting (40%)
Turnovers (25%)
Rebounding (20%)
Free Throws (15%)
So raw pace, on its own, tells you almost nothing about whether a team wins or loses. A slow team can be elite if it's efficient while a fast team can be mediocre if they don't convert their chances.
Next step: Moreyball rate
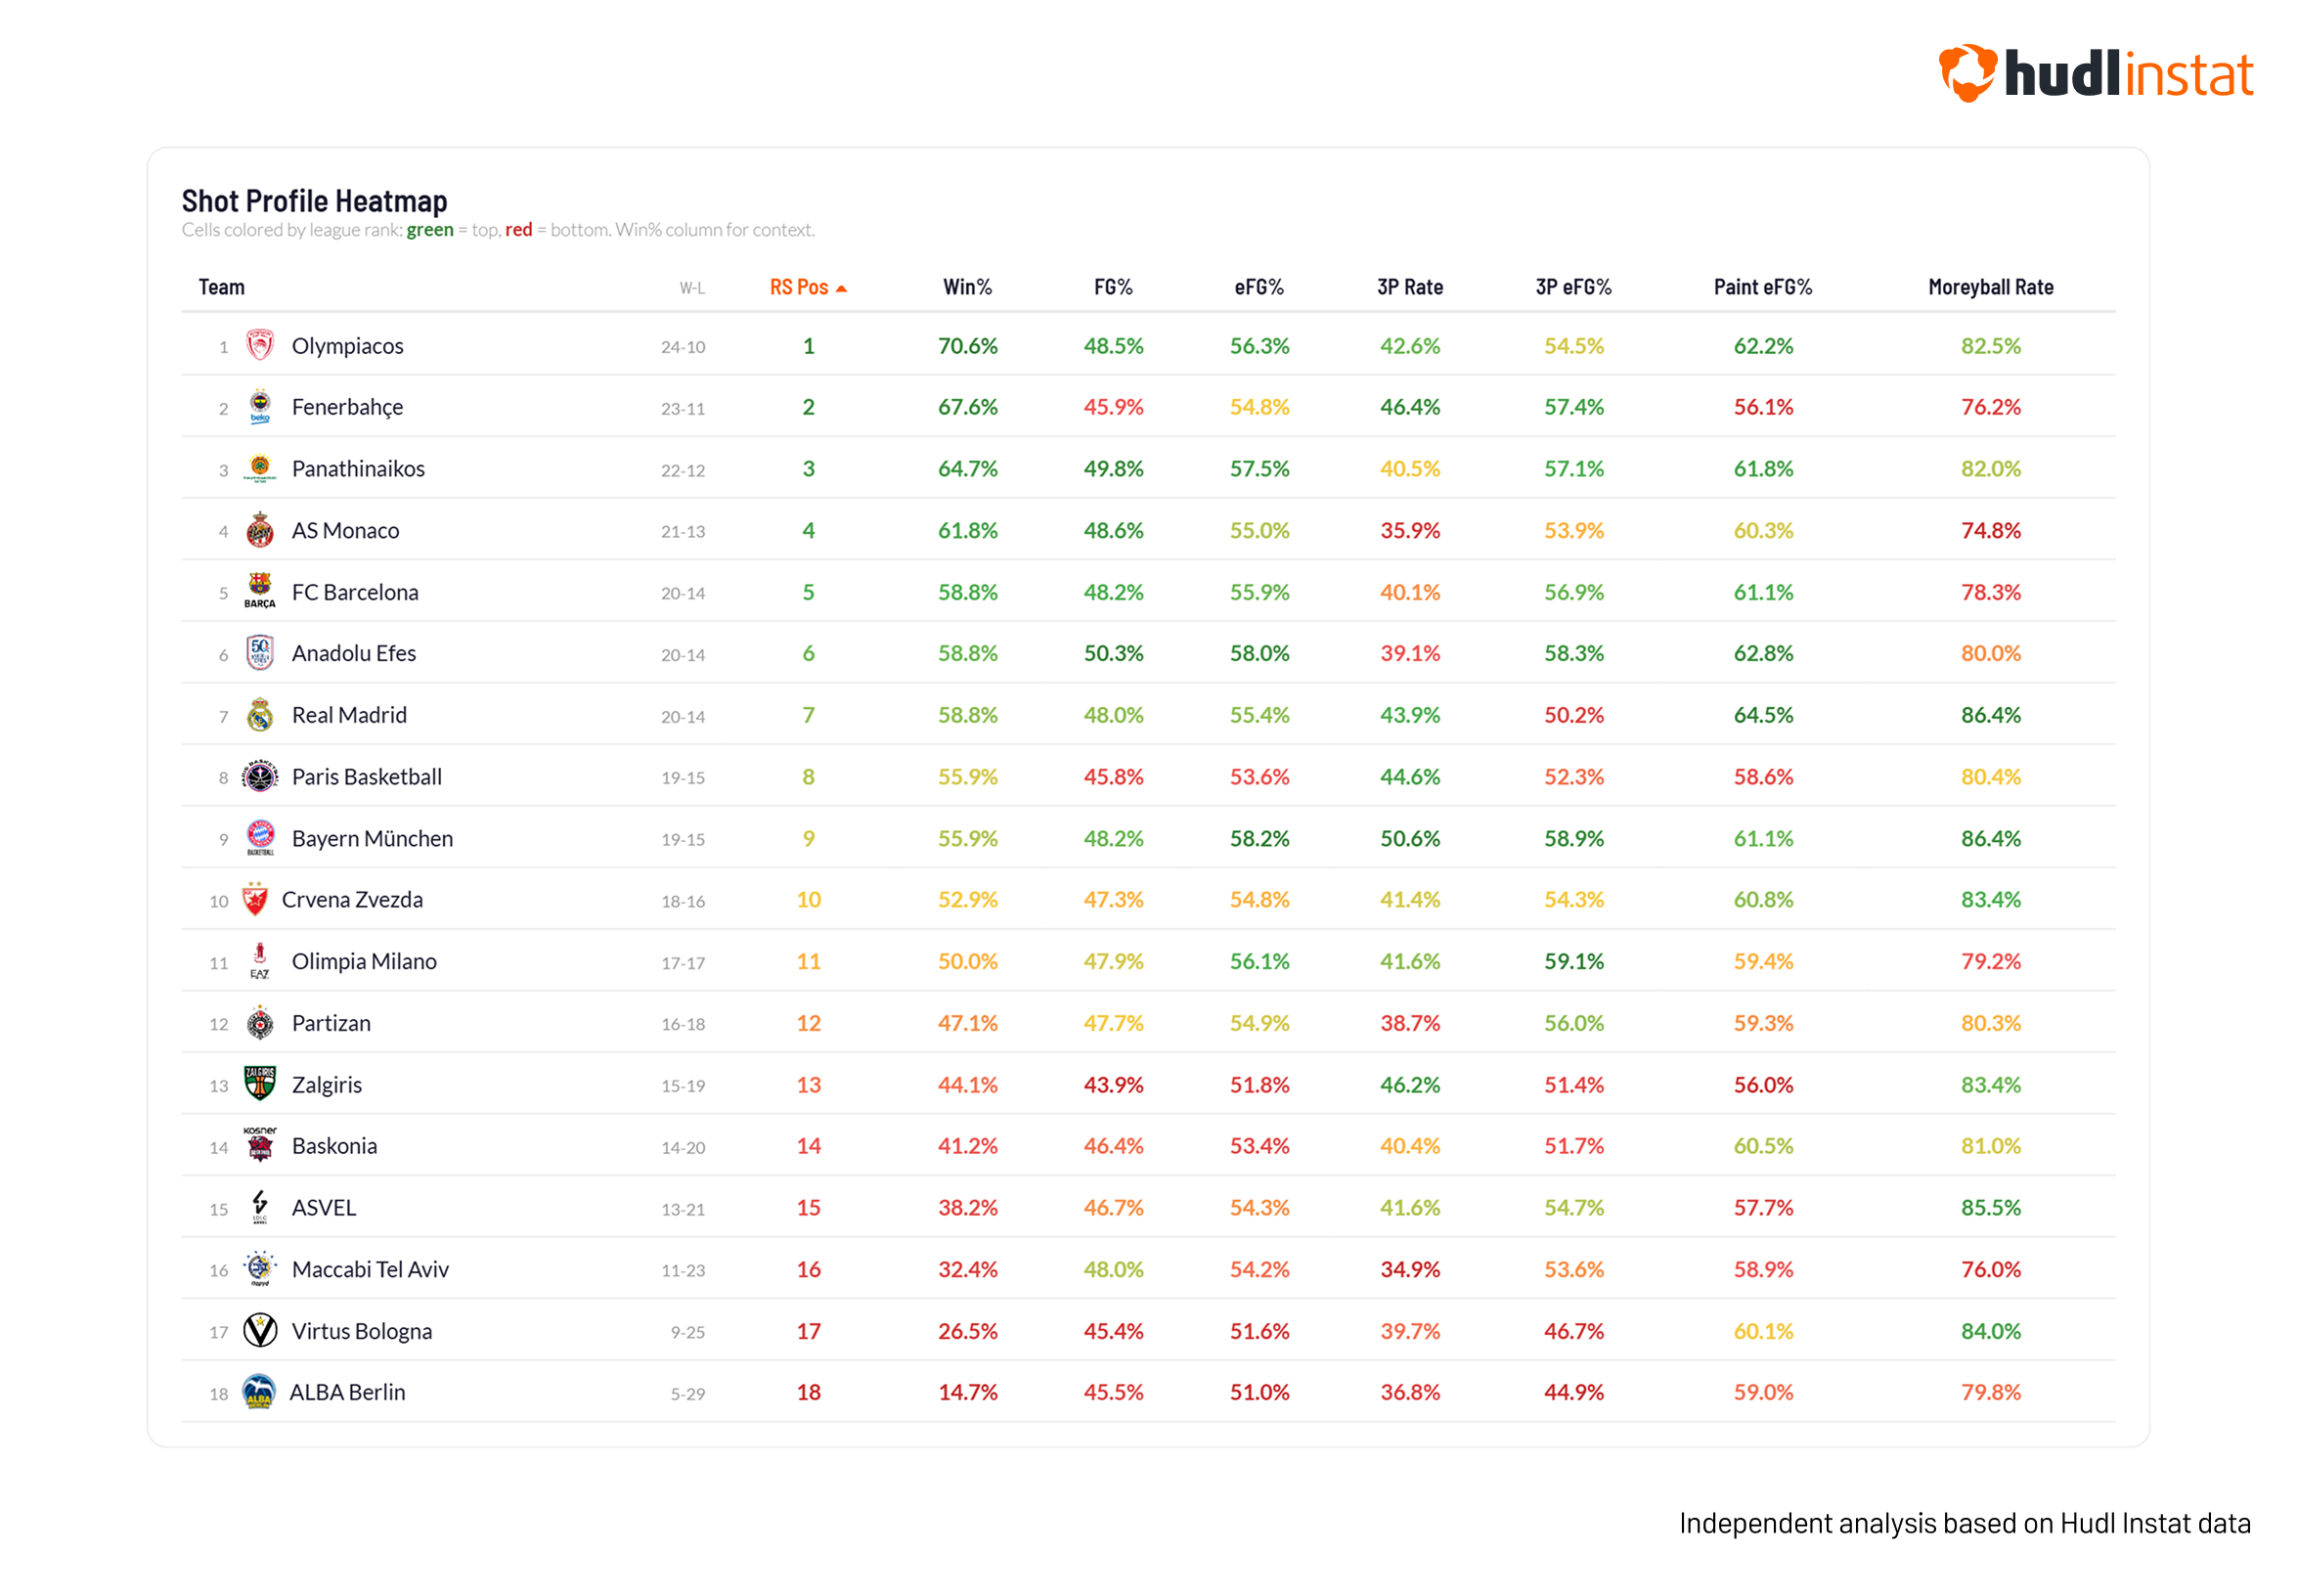
ASVEL Villeurbanne had one of the highest Moreyball Rates in the EuroLeague last season — 86% of their shots come from either at the rim or behind the three-point line. By the analytics textbook, that's close to perfect.
They finished 15th.
Fenerbahçe, the reigning champions, have the lowest Moreyball Rate in the league: 76%. They take more mid-range shots than anyone else.
They finished 2nd.
The league at a glance. Green = top of the league, red = bottom. Note how eFG% tracks closely with Win%, while Moreyball Rate doesn't.
The numbers are tighter than you'd think. Moreyball Rates range from Monaco's 75% to Real Madrid and Bayern's 86%. That's an 11-point spread for the entire 18-team field — narrow enough to suggest we've reached something like a consensus on where to shoot from.
Mid-range attempts account for just 13% of total shots and convert at the league's worst efficiency (39% eFG). The three-point rate sits at 41%, and here's what might surprise NBA-centric readers: recent research by Foteinakis and Pavlidou (2025) found that the EuroLeague actually has a higher three-point attempt rate than the NBA, driven partly by the shorter 6.75m arc.
When the exception becomes the norm
Jared Dubin coined the "Moreyball Rate" metric for FiveThirtyEight back in 2018, when he noticed that nearly every NBA team had adopted Houston's approach and the Rockets' competitive edge was evaporating. The same thing has happened in Europe, perhaps with a few years' delay, as it usually happens with everything related to analytics.
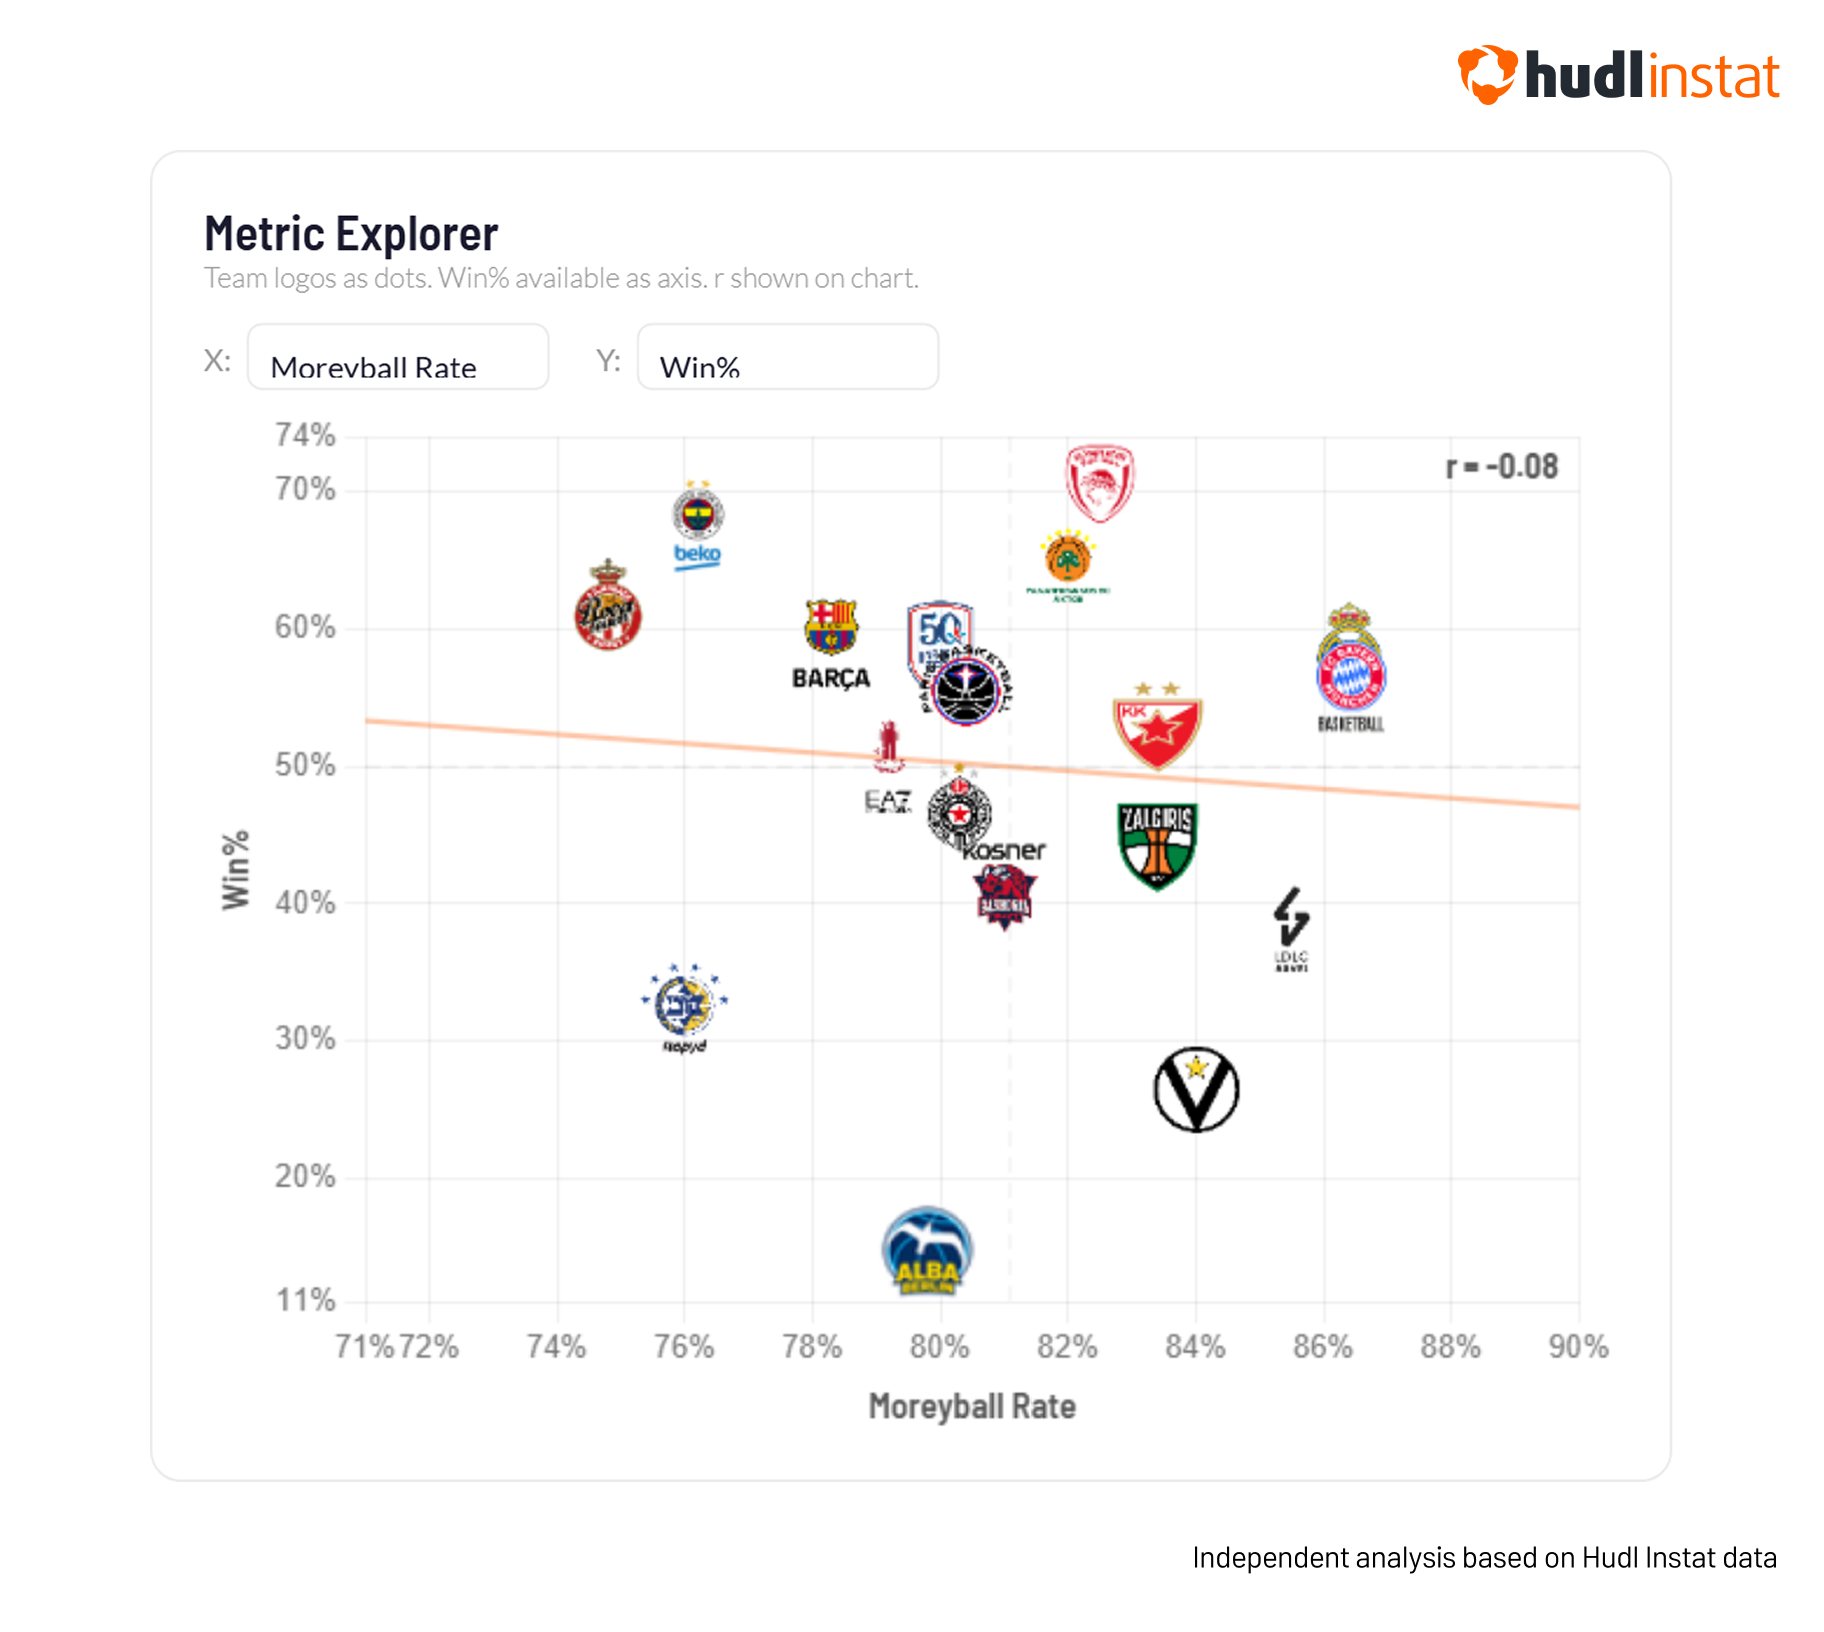
But when I ran the correlation between Moreyball Rate and Win% across all 18 EuroLeague teams, the result was r = -0.07.
For the non-stats readers: that's essentially zero. No relationship whatsoever.
Moreyball Rate vs. eFG%. No relationship. The flattest trendline you'll see in sports analytics.
Look at the extremes. ASVEL (86% Moreyball, 38% Win%), Virtus Bologna (84%, 27%), and Zalgiris (83%, 44%) all sit in the top third of shot selection discipline — and the bottom third of the standings. Meanwhile, Monaco (75%), Fenerbahçe (76%), and Barcelona (78%) have among the lowest Moreyball Rates and are all playoff-bound.
This doesn't mean Moreyball was wrong. The expected value math still holds. A league-average mid-range shot is still the worst shot on the court. But when every team takes 75-86% of its shots from the two most efficient zones, there's just not much room left to gain by tweaking your shot diet. The spread is too narrow. At this point, thedifference between teams comes down to who actually makes the shots — not where they're taking them from.
And we also need to factor in who is shooting, because a better player will score more efficiently. We can probably all admit that the Fenerbahçe roster was way better than ASVEL, right?
Transition: the rising tide every team wants to surf
If pace itself doesn't drive efficiency, what about transition offense — the fastest, most efficient play type in the game? I analyzed transition and half-court efficiency separately for all 18 teams, and the finding was clear: transition is where everyone is good.
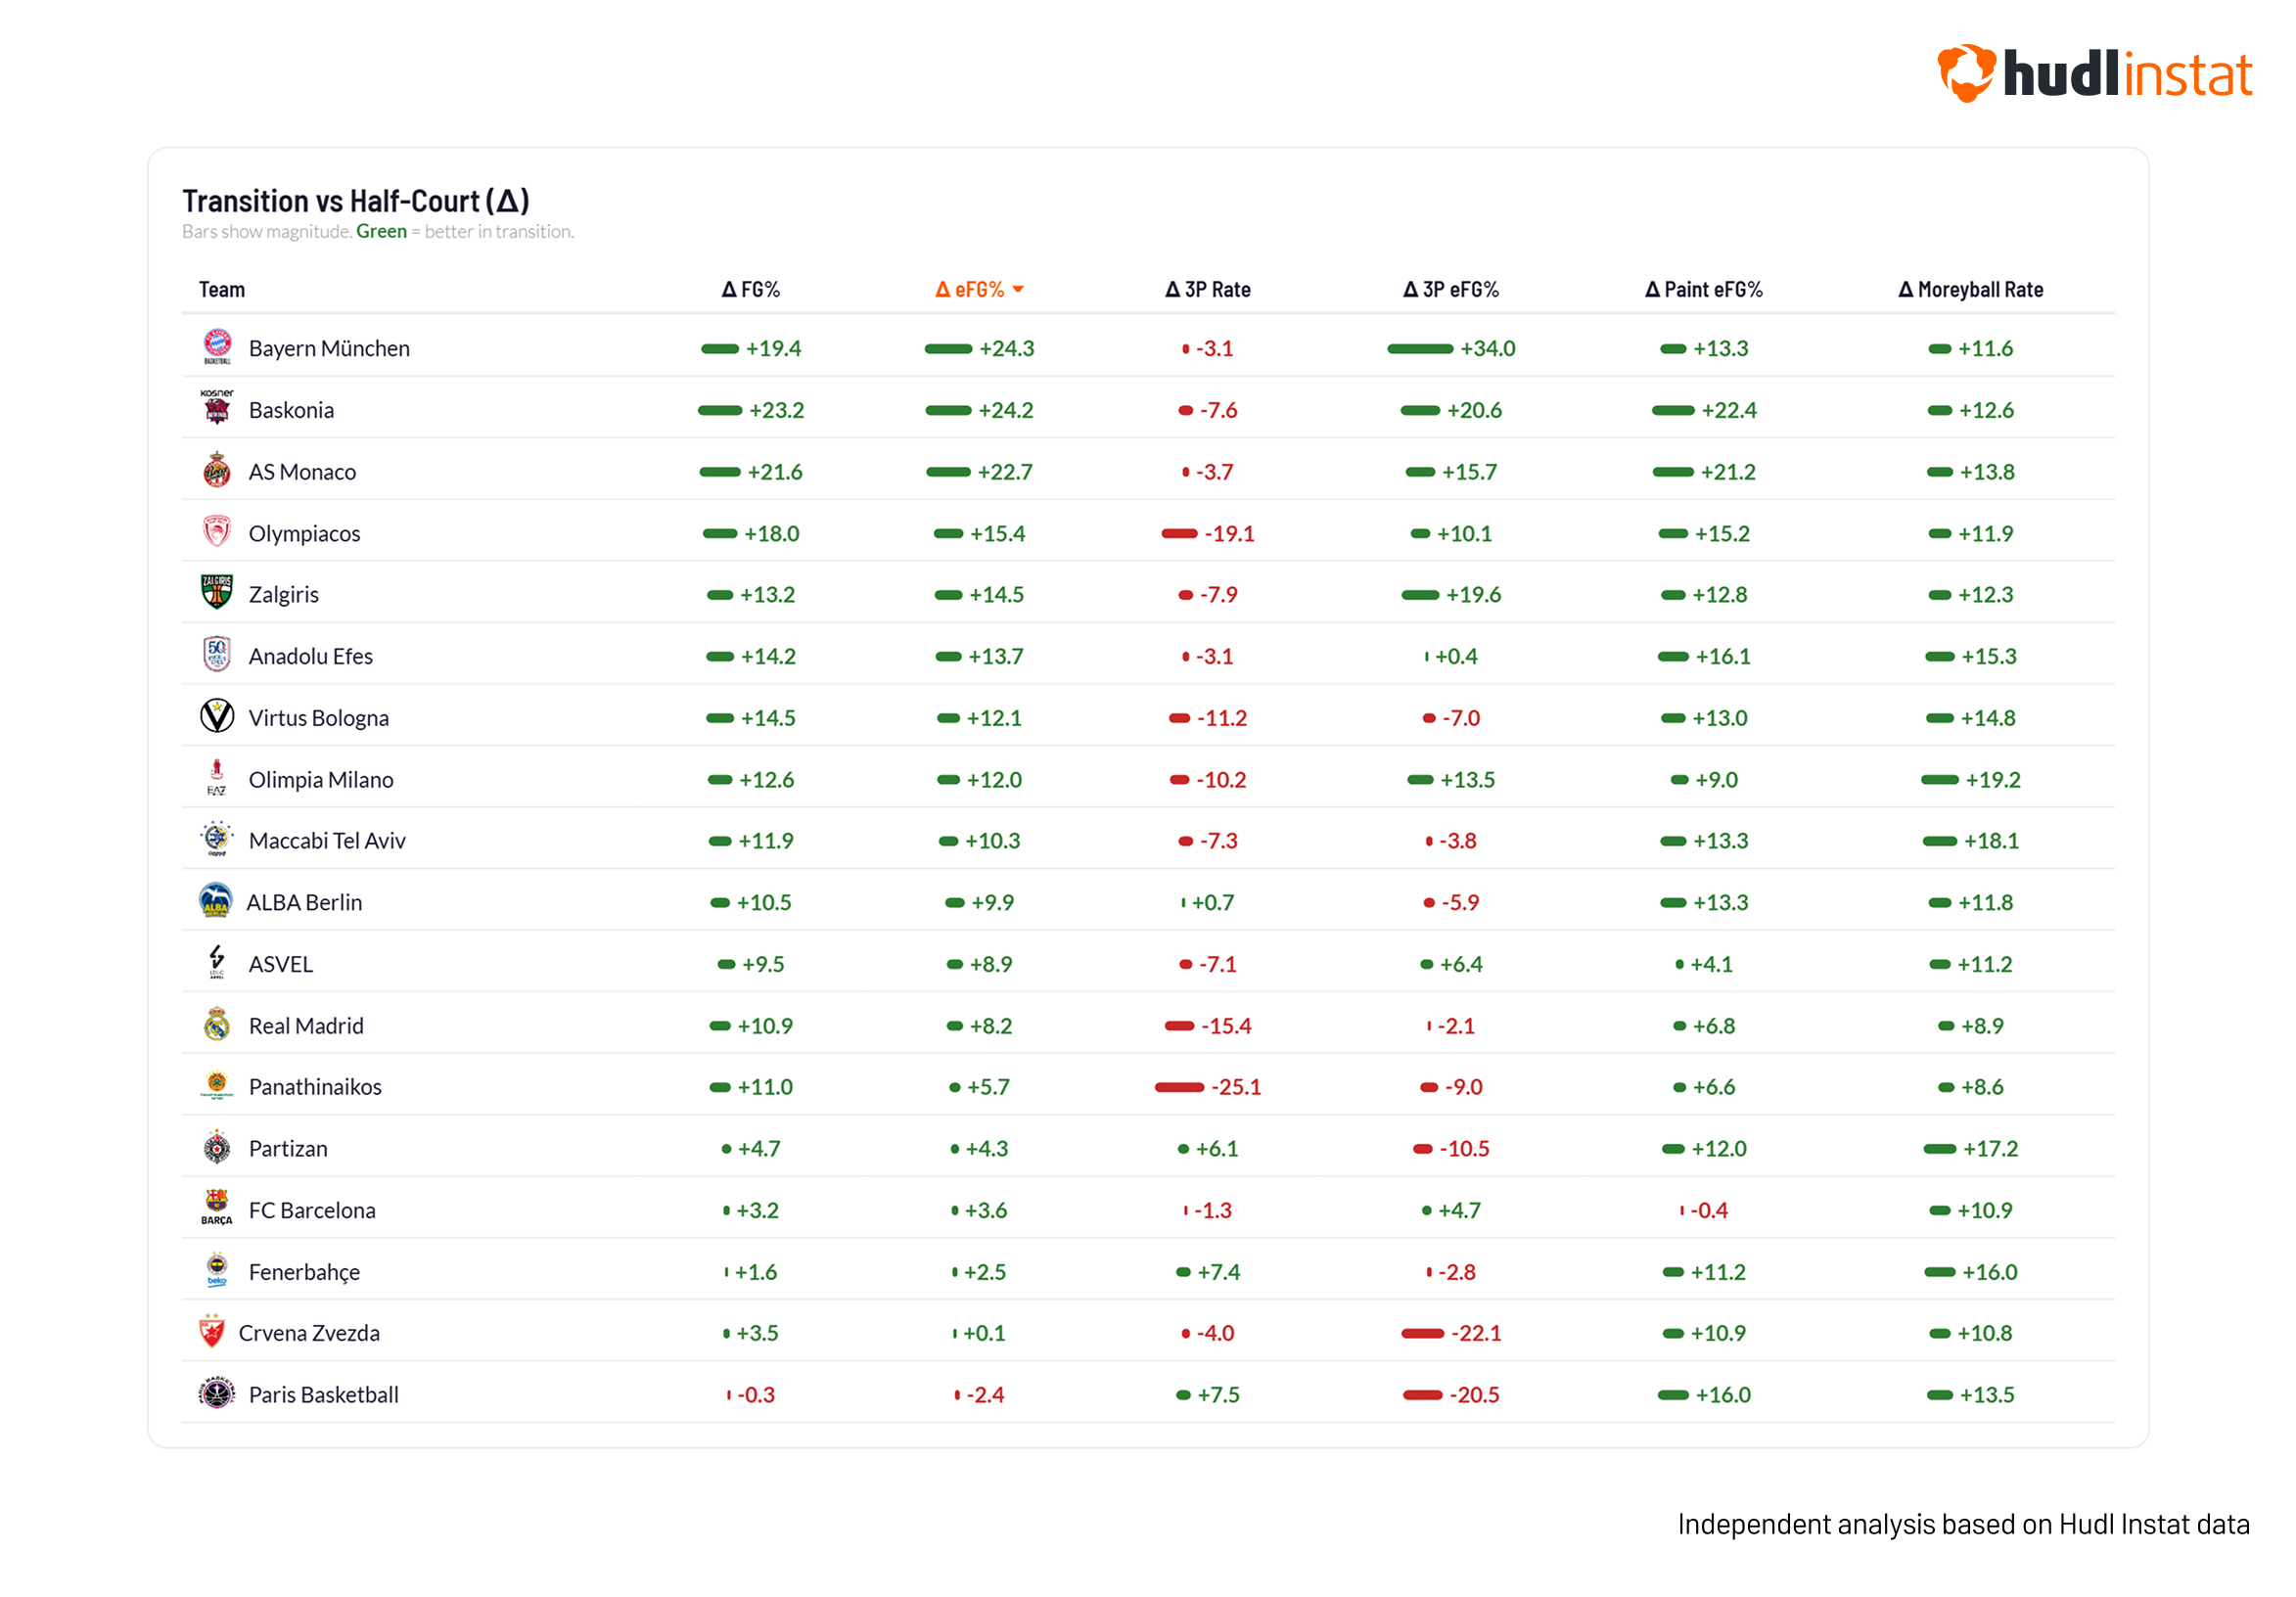
The league-wide eFG% jumps from 54% in half-court sets to 65% in transition — a 10.6-point boost. Every single team except one improves in transition. The range is wide (Bayern at +24.3 points, Paris at -2.4), but the correlation between transition efficiency and winning is weak: r = 0.11.
Compare that to half-court eFG% at r = 0.76.
Every team (except Paris) gets better in transition. Bayern's +24.3 boost is the largest in the league. But transition efficiency barely predicts winning.
It makes sense if you think about it: when everyone shoots 60-70% eFG in transition, nobody gains an edge from it. You need to be competent in the open court — you can't afford to waste easy baskets — but transition alone isn't winning you a 34-game EuroLeague season.
Ben Falk's work at Cleaning the Glass has shown a similar dynamic in the NBA: transition matters, but the real separation happens when the defense is set and you need to create advantages in the half-court.
The exceptions are worth a closer look, though. Bayern München sees a +24.3 eFG% boost in transition, the largest in the league, suggesting a team built to run. Paris is the only team that gets worse in transition (-2.4 eFG% vs. half-court), which is puzzling and worth a deeper look in the film-based follow-up article.
Can we actually predict winning?
The correlation hierarchy across half-court metrics is clear:
eFG% is by far the strongest predictor. Teams that make their shots win games. This confirms what Oliver's Four Factors framework established two decades ago, and what Falk's Cleaning the Glass data has shown consistently: eFG% is the single most important factor in basketball success.
3Pt eFG% is an important metric too, as making threes matters more than taking them. And the Moreyball Rate has even lower correlation, close to zero signal.
Basketball Index found that raw eFG% correlates year-to-year at just 0.28, while their "Shot Making" metric — how well a player converts relative to shot difficulty — correlates at 0.66. The ability to make tough shots is a more stable and predictive skill than simply taking easy ones. That lines up with what I see in the EuroLeague data: the teams at the top have players who convert from the zones everyone targets.
What the shooting profiles reveal
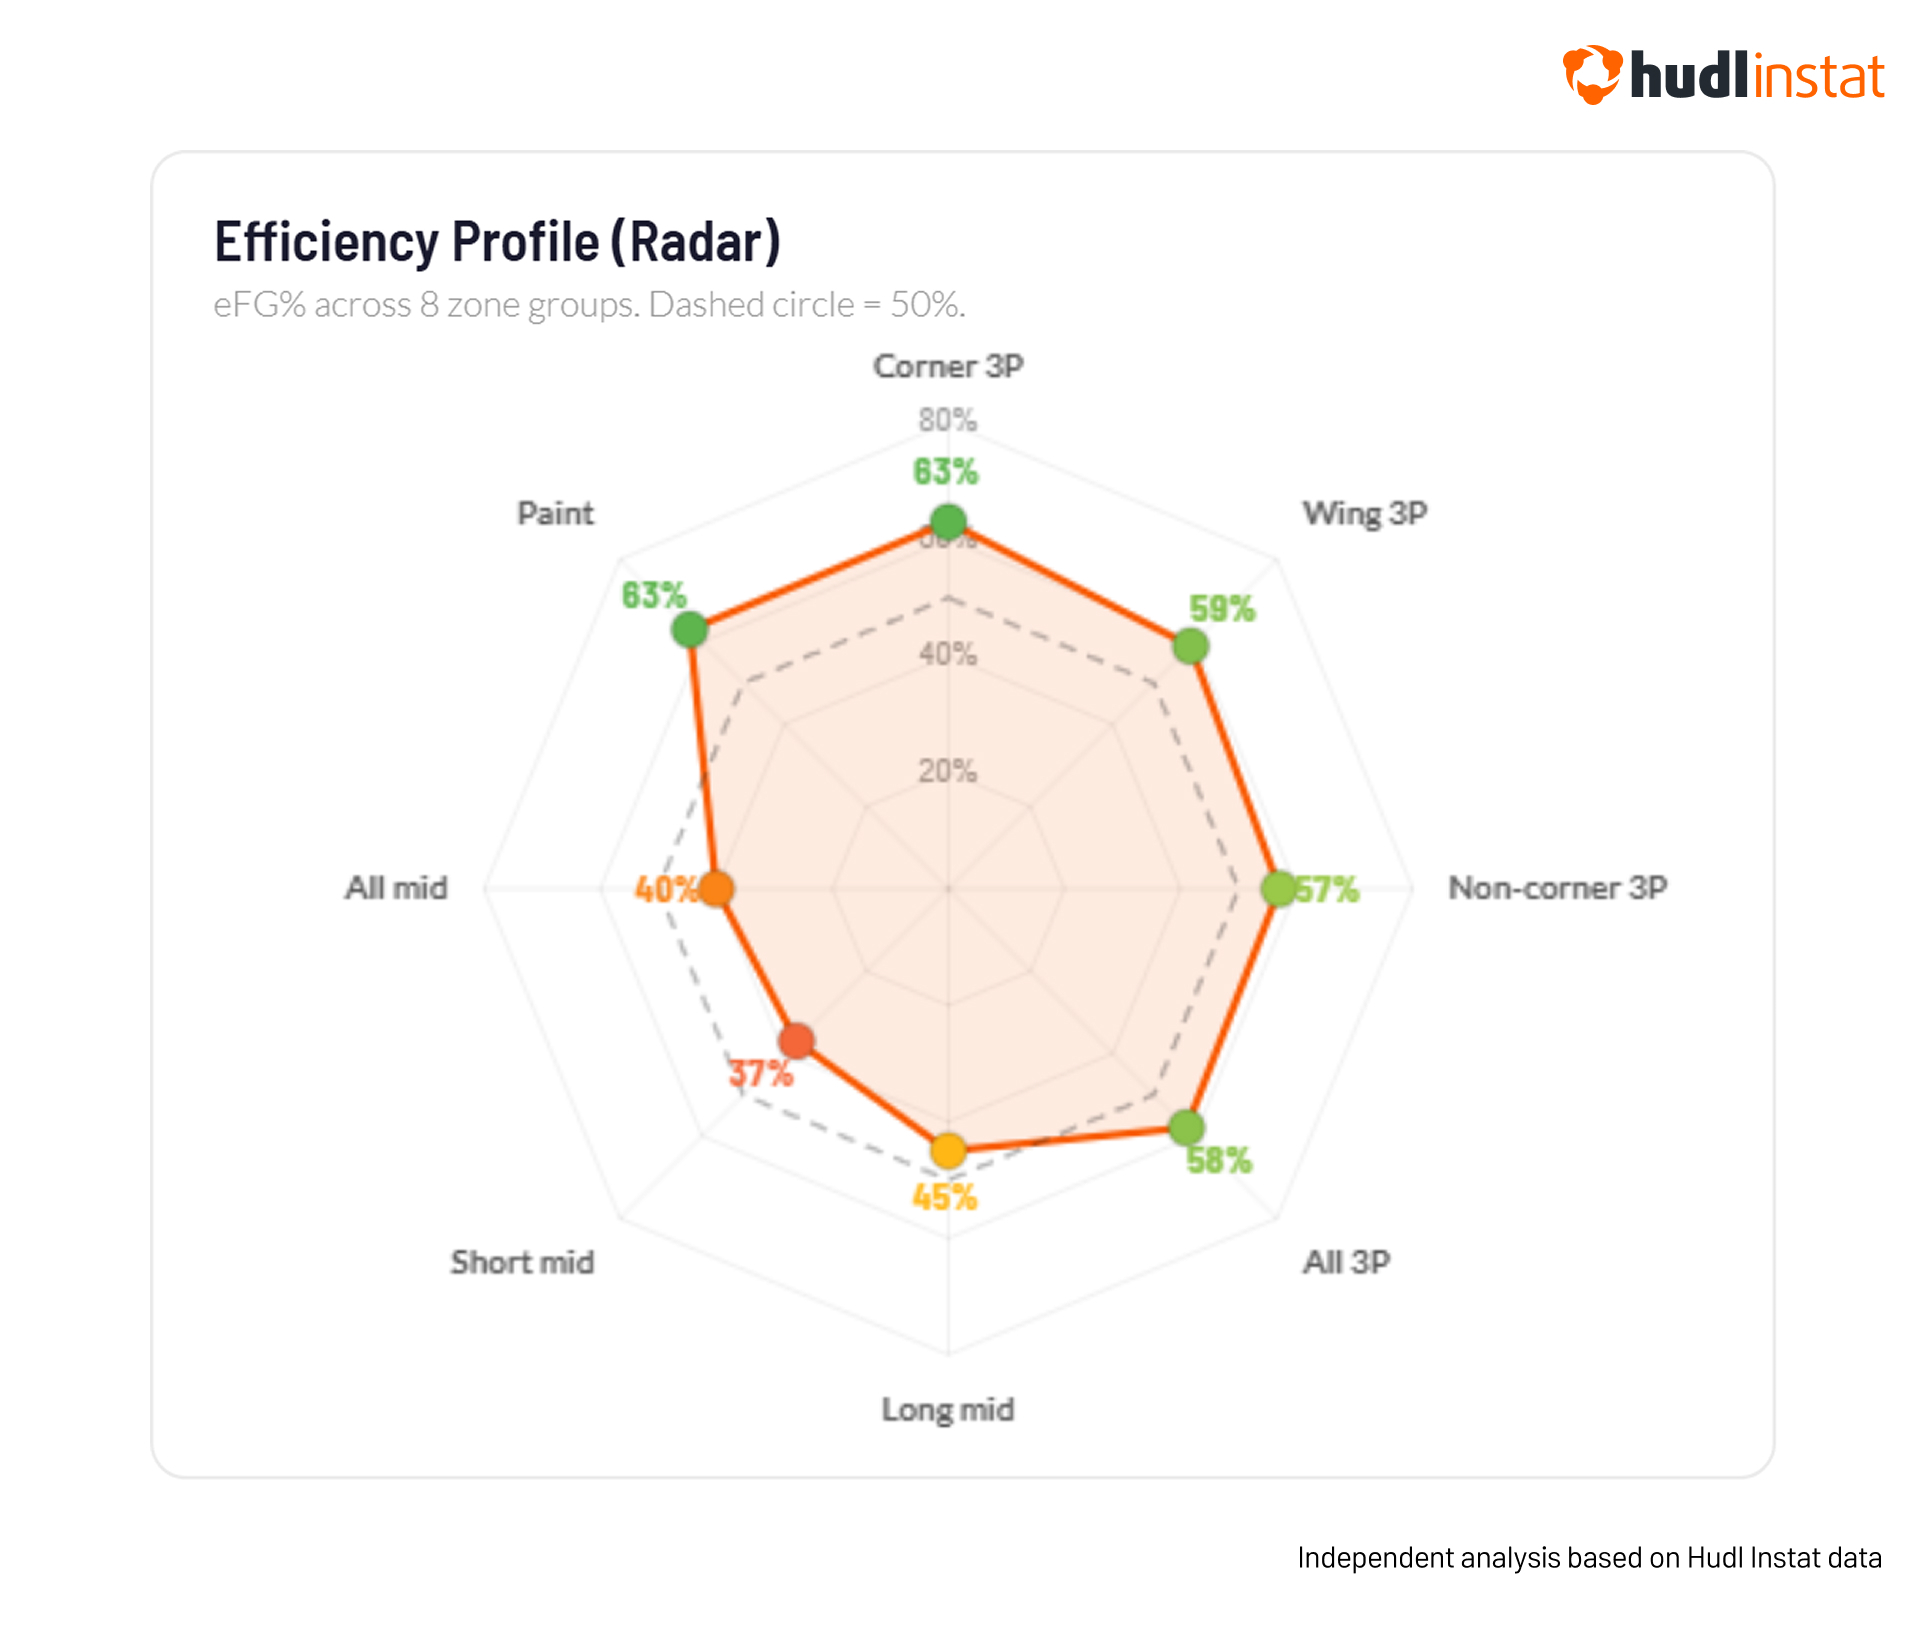
Shot selection looks the same across the league. Execution doesn't. When you look at the shooting profile radars — eight zone groups mapped by eFG% — no two teams look alike, even if their Moreyball Rates are similar.
Anadolu Efes: 58% eFG, the league's most efficient offense. No weak spots across any zone group compared to league average (dashed grey).
Efes has the best shooting efficiency in the league. There are no weak spots on their radar — strong from the corners (63%), the wings (58%), and the paint (63%). That's what a roster full of high-level shot-makers looks like in the data.
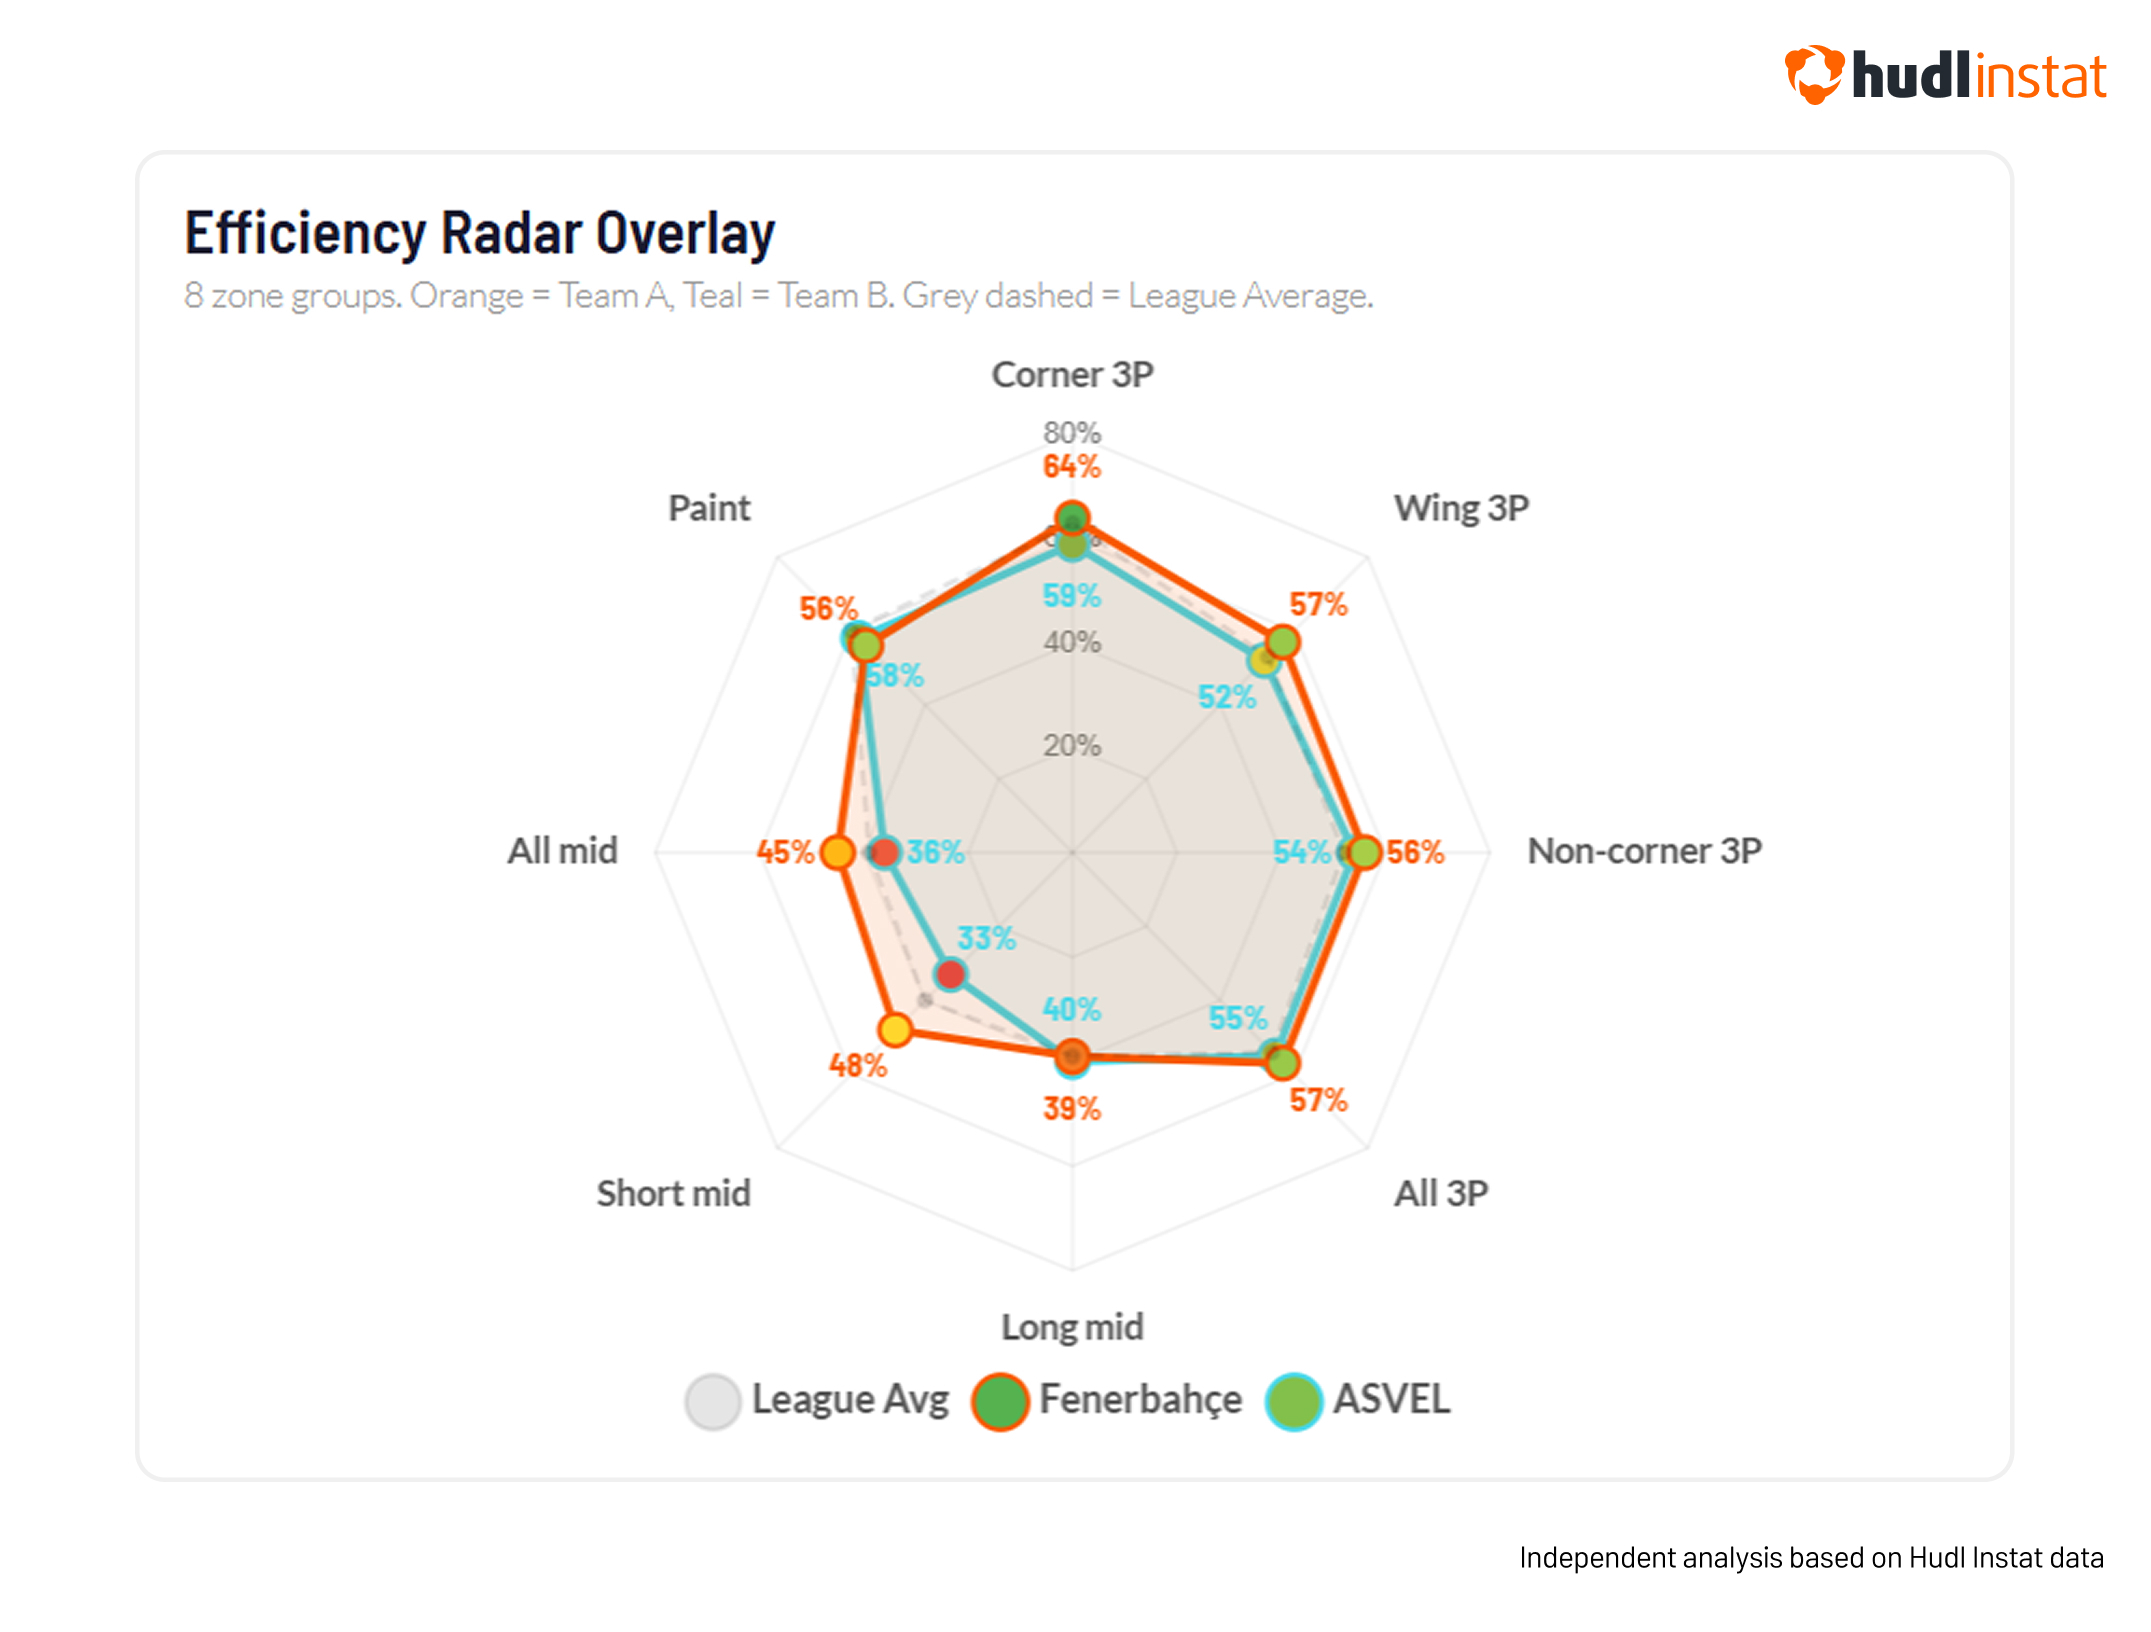
Fenerbahçe is the opposite story. The lowest Moreyball Rate, but a functional 55% eFG and a title defense to show for it. Their mid-range shots aren't a weakness because they have the personnel to convert them. Georgios Giasemidis reached the same conclusion in his independent EuroLeague analysis: the correlation between mid-range volume and winning was -0.15, statistically insignificant. A mid-range shot is only inefficient if taken by a mediocre shooter.
Two approaches, opposite results. Fenerbahçe (orange) takes more mid-range but converts efficiently. ASVEL (teal) follows the Moreyball script but can't match the execution.
And then there's ALBA Berlin, who make the whole argument in one line: 80% Moreyball Rate (above league average), decent shot selection — but the worst eFG% in the league at 51%. They take the right shots and miss them. No system can overcome that.
Where this leaves us
The analytics revolution in European basketball achieved exactly what it set out to do. It optimized shot selection. Teams shoot more threes, attack the rim, and have largely abandoned the mid-range as a primary weapon. The EuroLeague's shot distribution looks more like the NBA's than it ever has.
But there's a limit to how much you can gain from shooting philosophy alone. When everyone has bought into the same principles, the edge stops being about the system and starts being about the people running it. In the 2024-25 EuroLeague, the question now isn't whether teams are taking the right shots: they are! It's about player development, shooting improvement, screen quality, and the ability to create clean looks against set defenses.
None of this means the last decade of analytical work was pointless. The league-wide shift to three-point-heavy, rim-attacking offense has raised the floor for everyone. Offensive ratings have climbed, the game is more efficient than ever, and the analytical framework that drove this change remains sound. But the low-hanging fruit is gone.
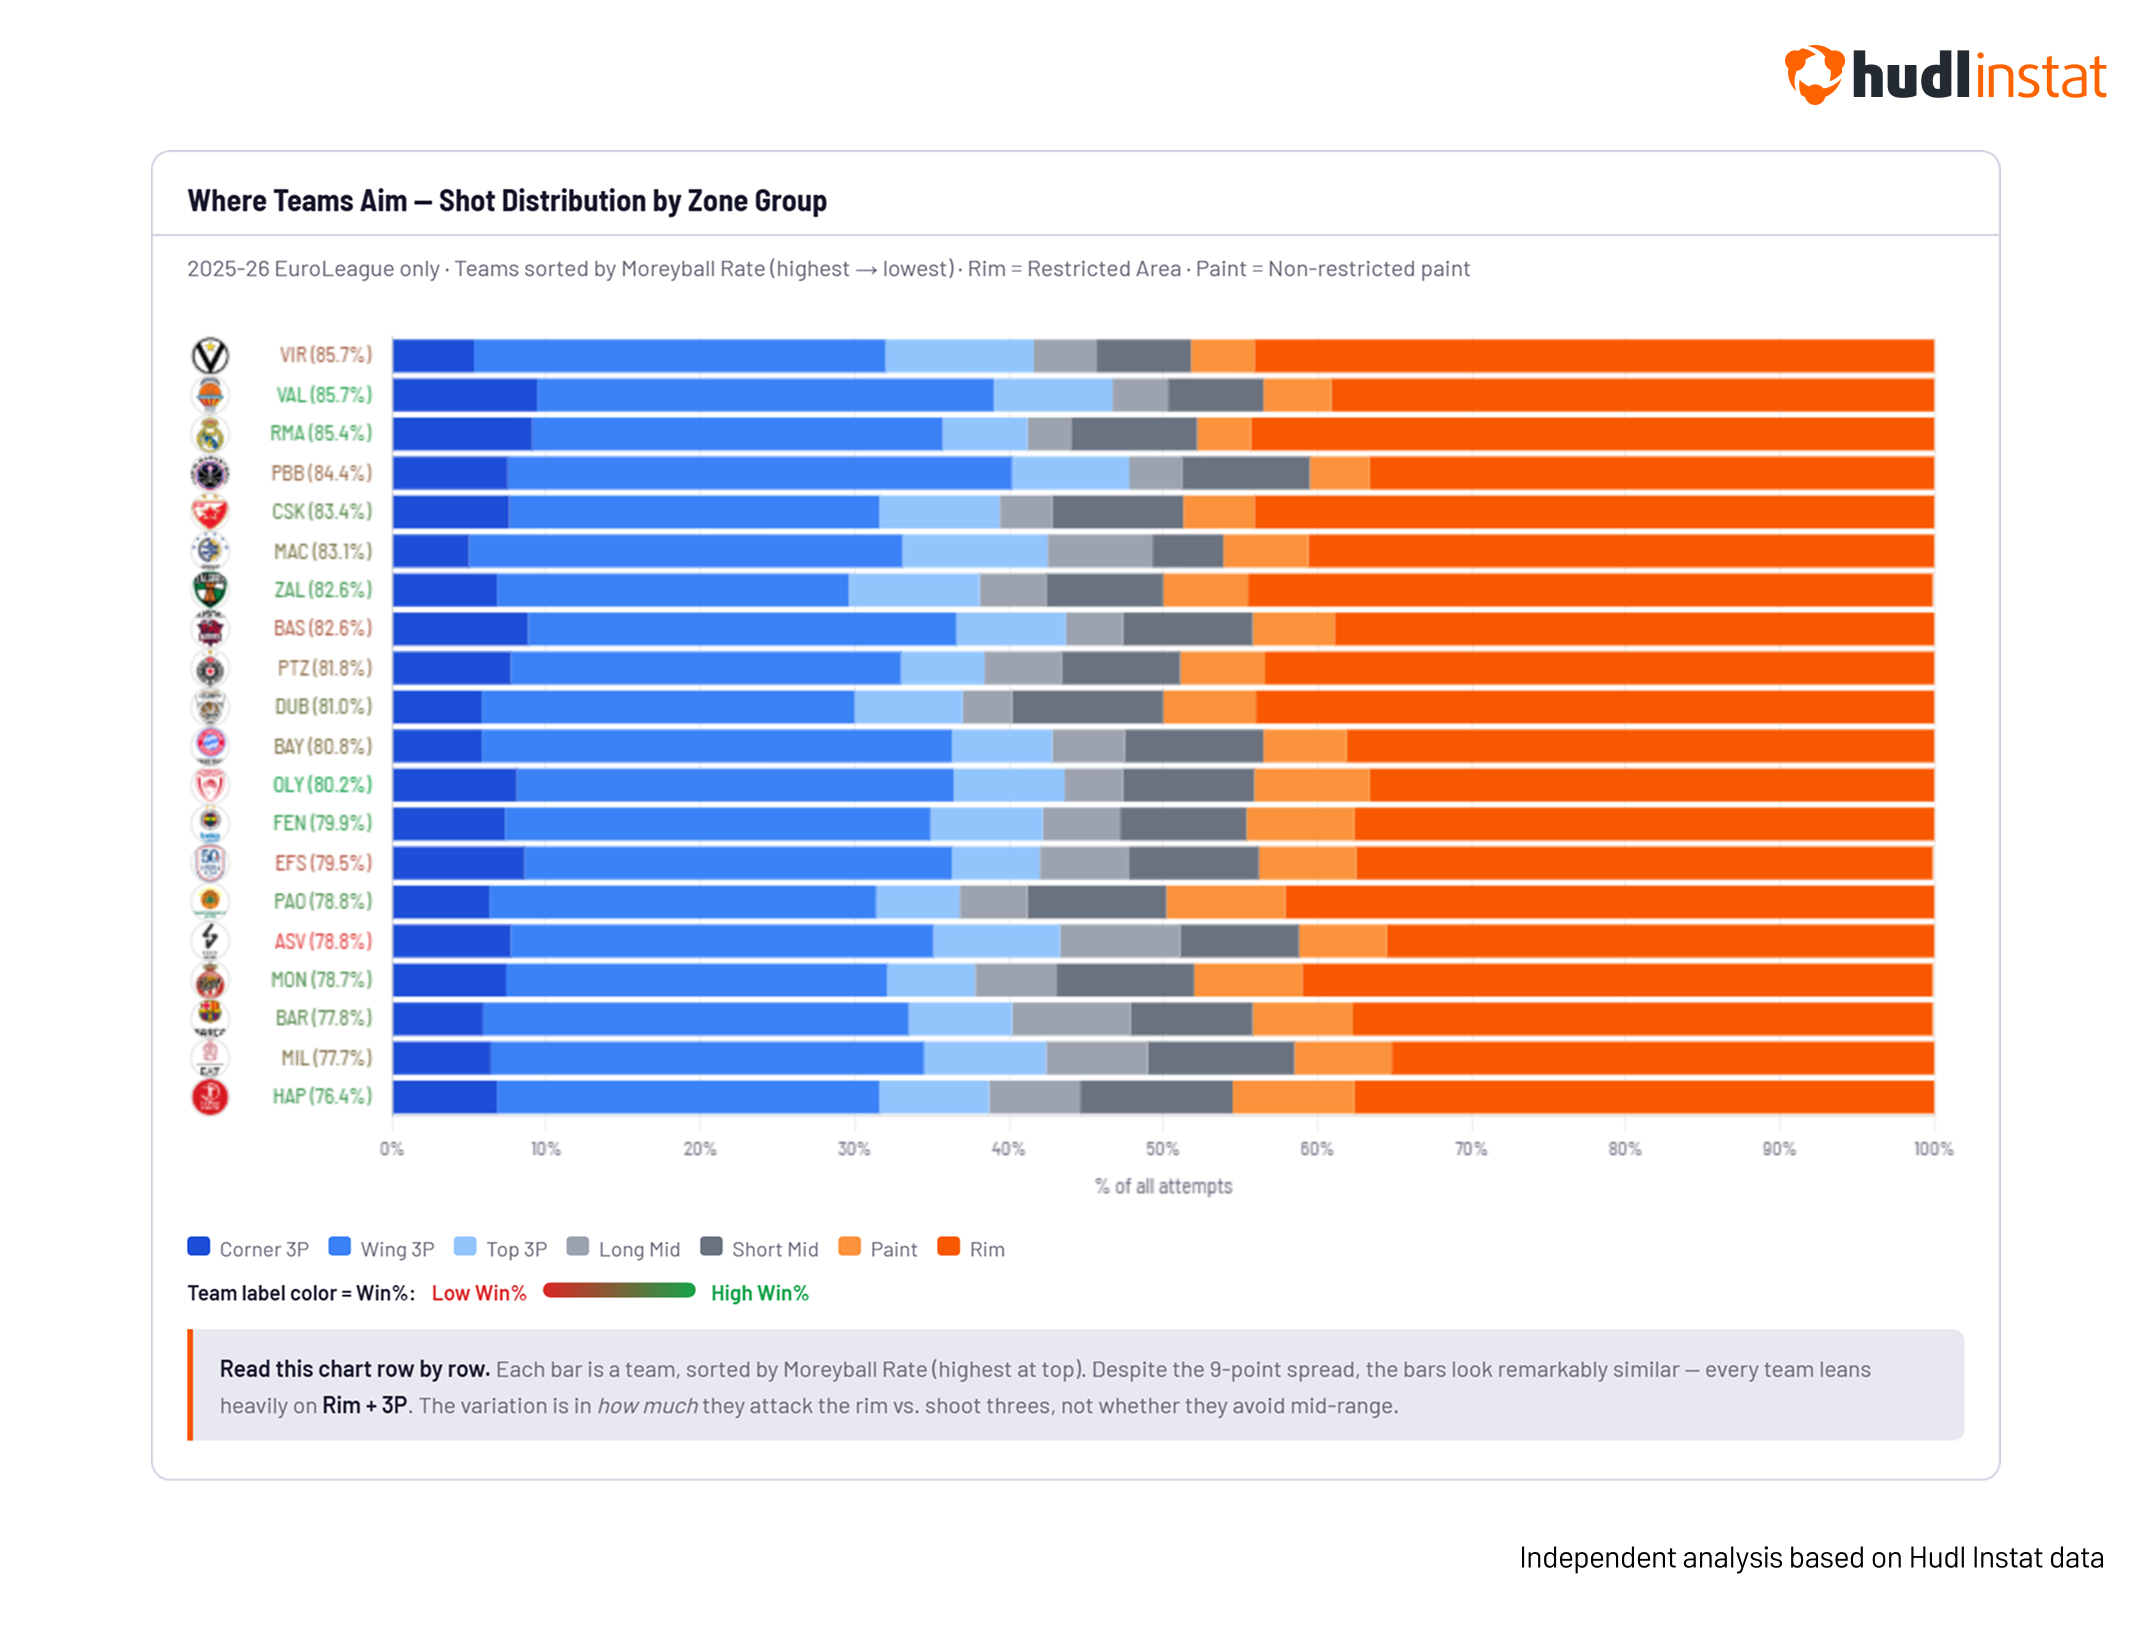
Shot attempts, broken into seven zone groups and sorted by Moreyball Rate (highest at top). Team labels are colored by Win% — red for the bottom of the standings, green for the top. The striking thing is how alike the bars look despite a 9-point spread in Moreyball Rate: the orange (Rim) and blue (3P) dominate every row.
What comes next is messier: developing shooters, improving screen quality, finding players who can create and convert against set defenses. The kind of work that doesn't fit neatly into a shot chart.
In the next article, I'll take these findings to the film room. We'll look at real game footage to understand what efficient and inefficient possessions actually look like; what a "good shot" means beyond the zone it comes from, and how the best teams in Europe create advantages that the shot chart alone can't capture.