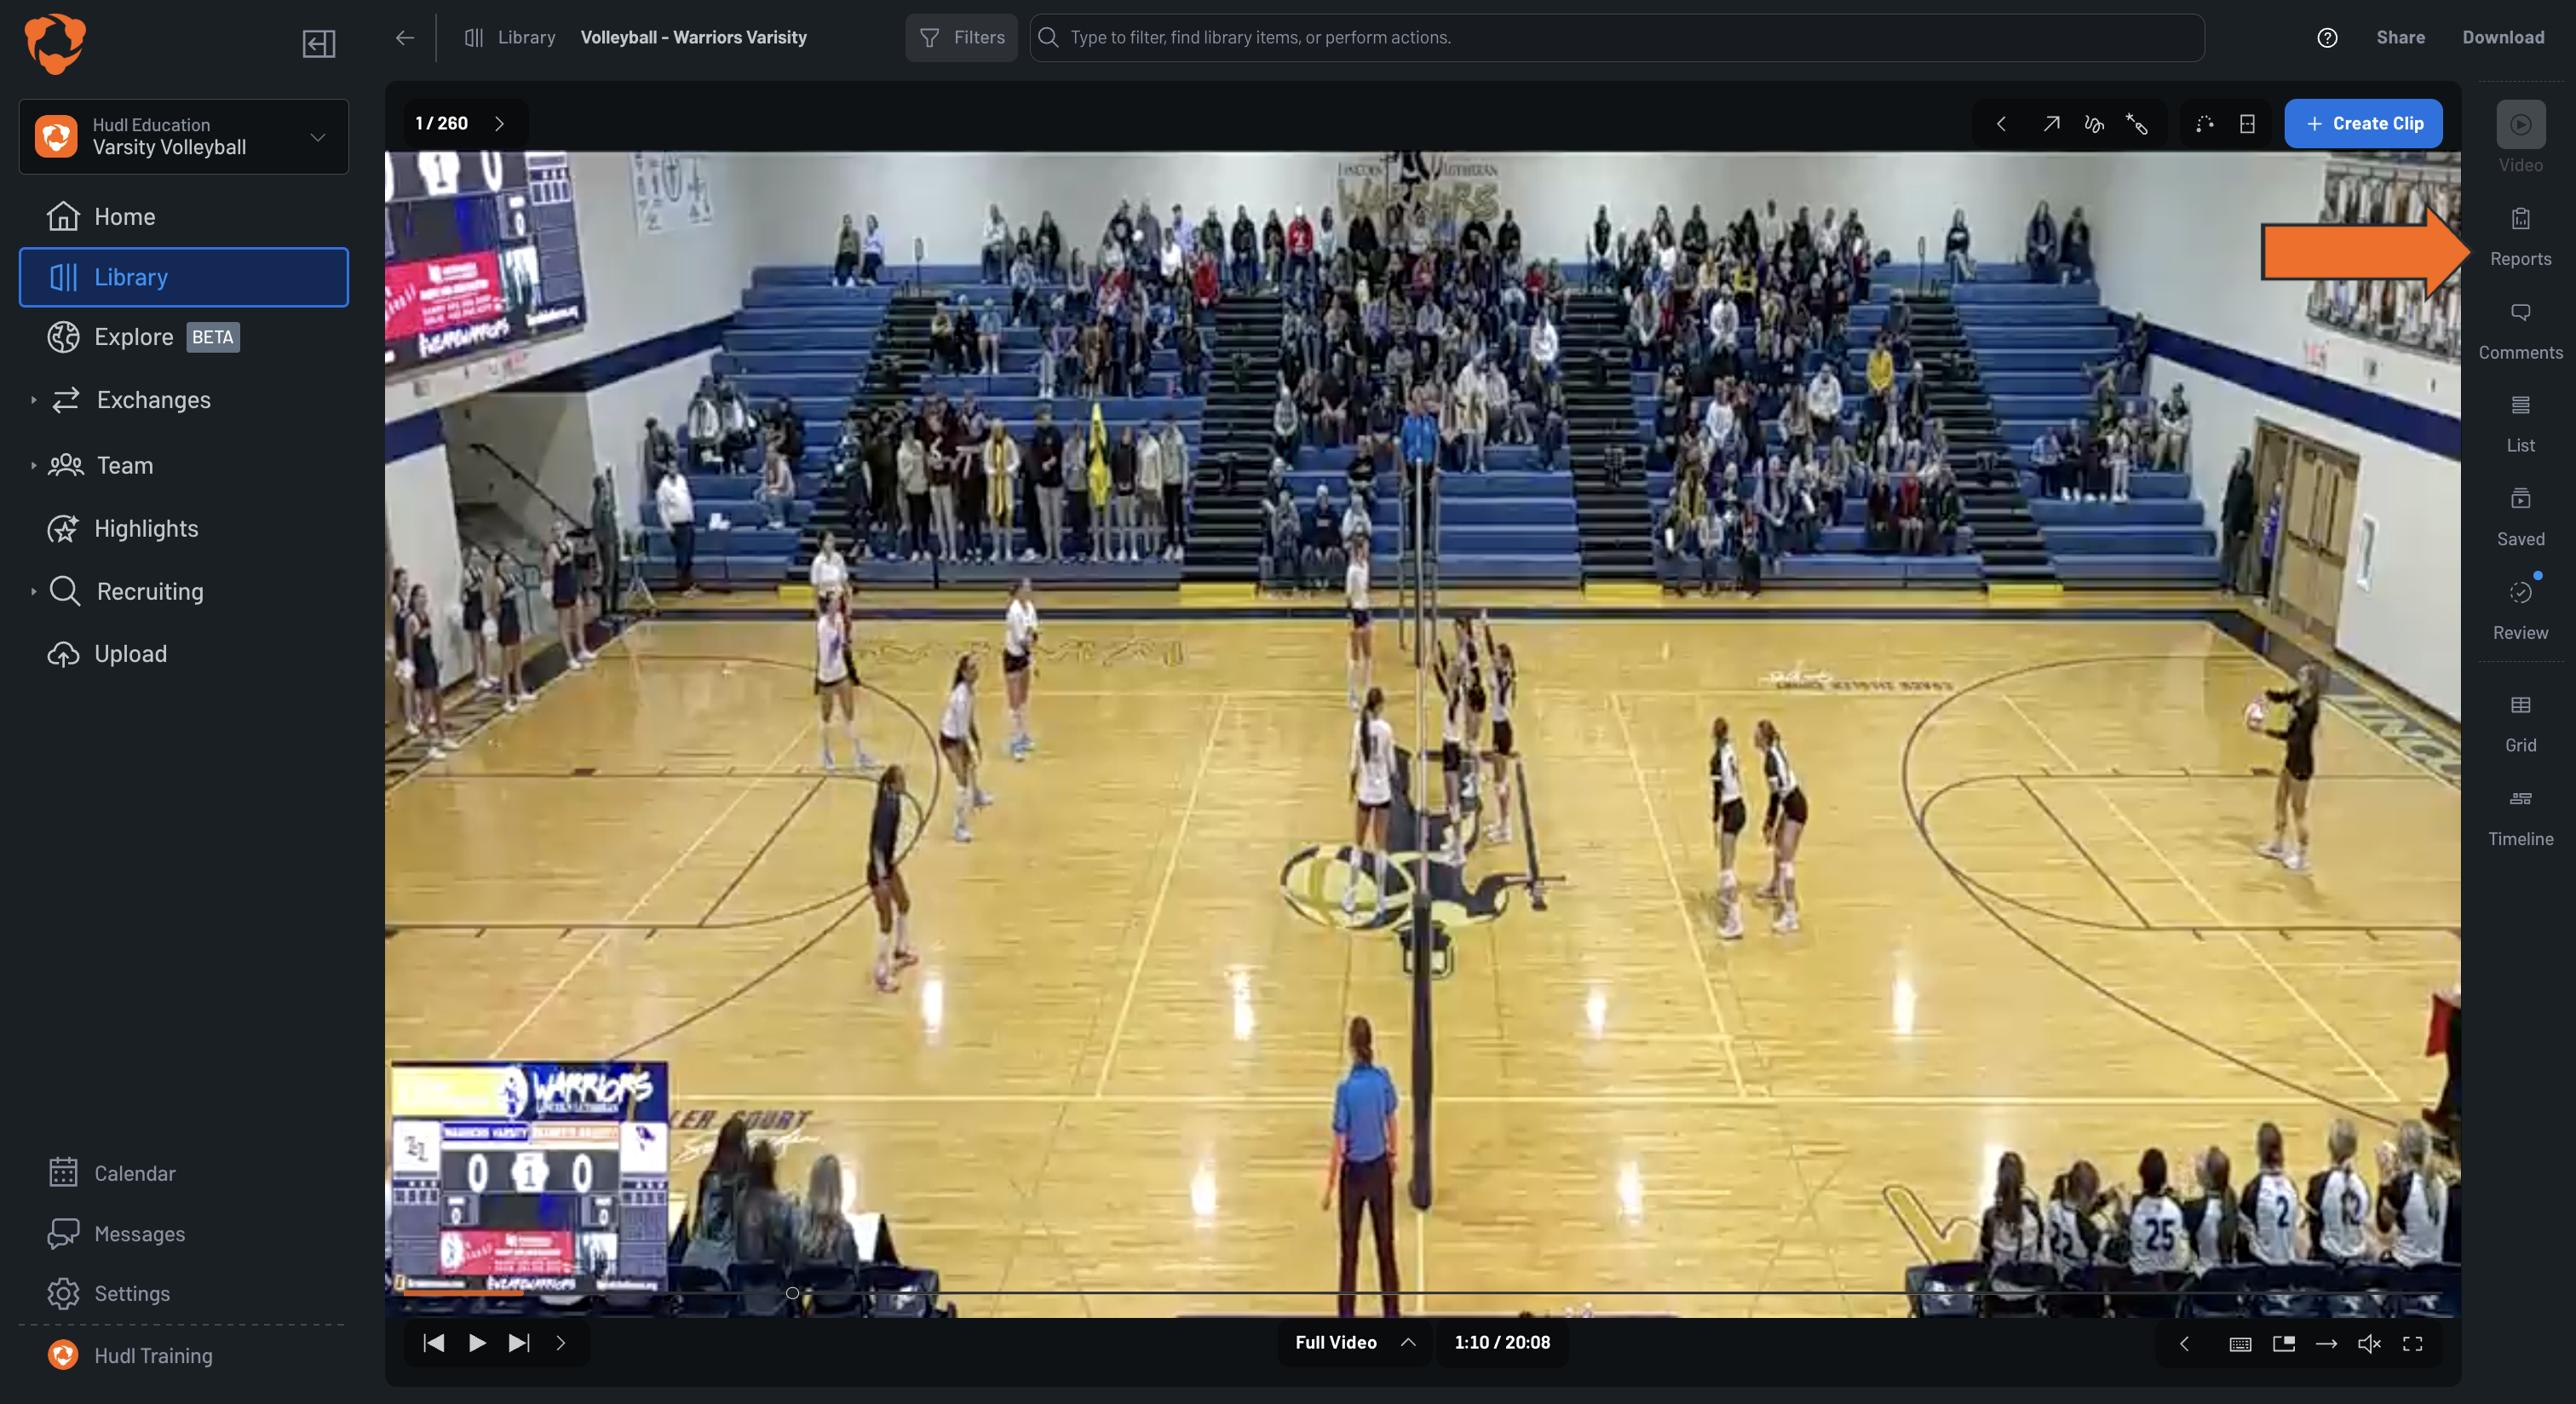
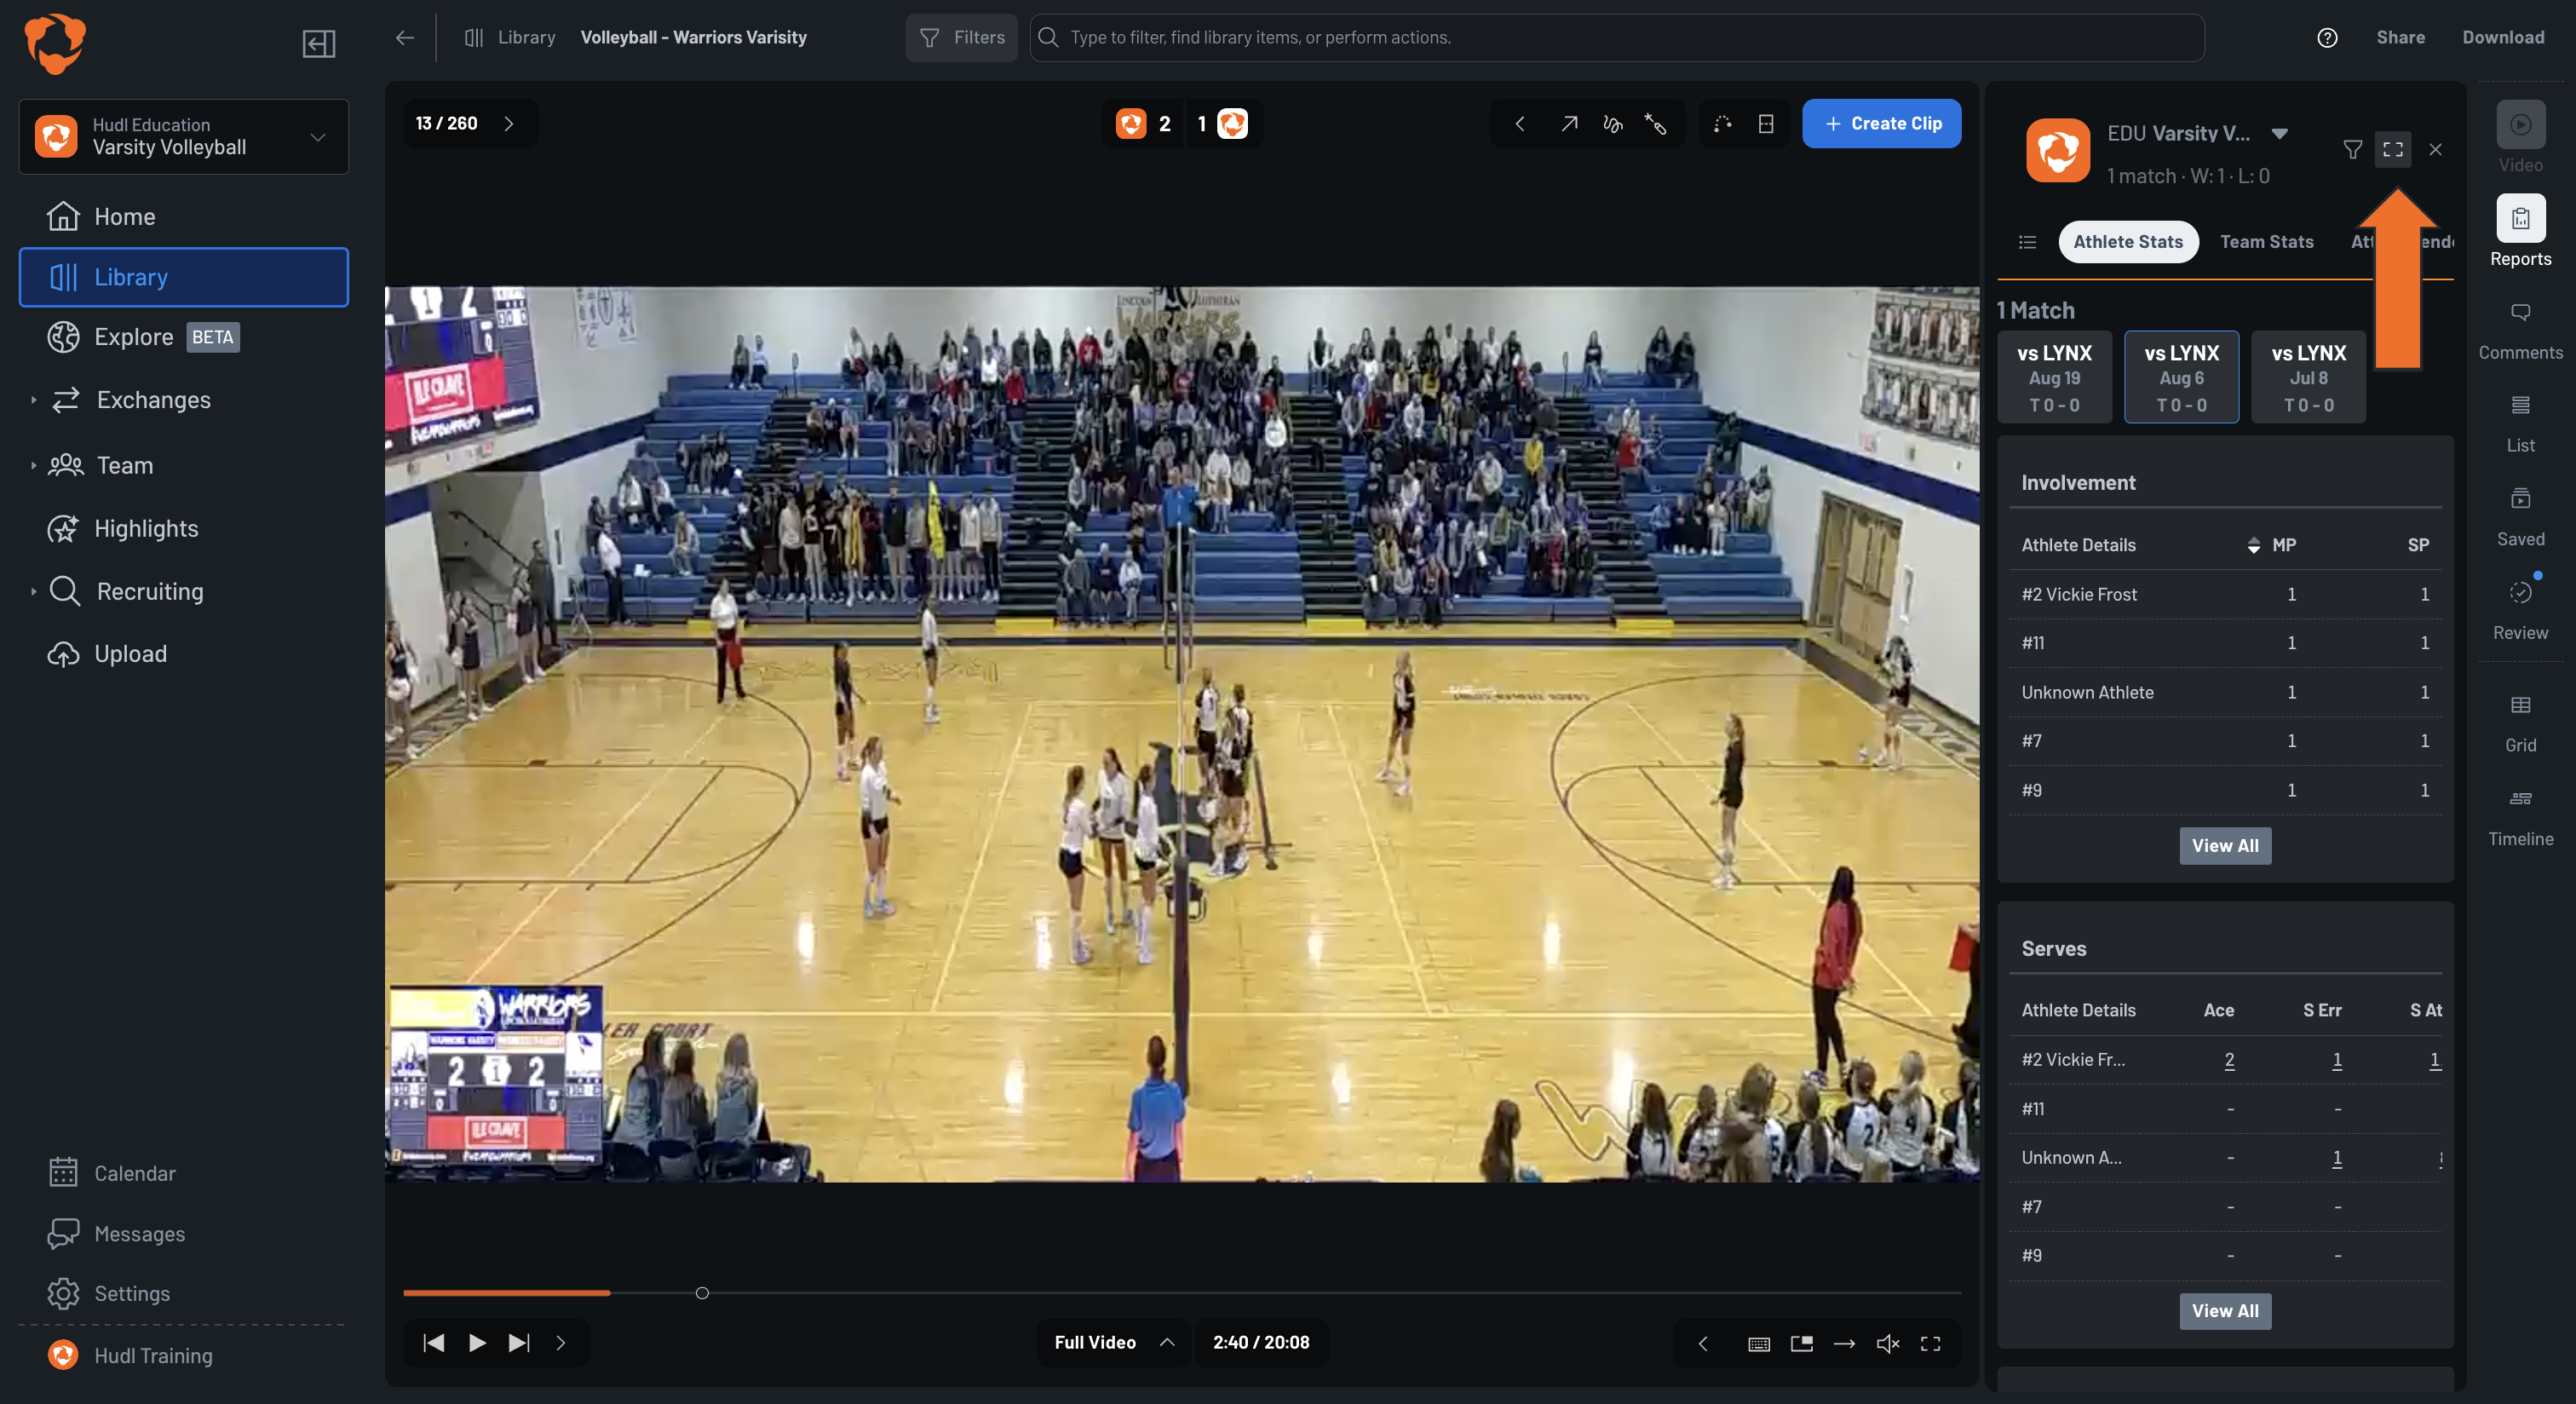
The Reports panel replaces the Stats modal. Click the Reports icon in the right sidebar to open it, then select a match to load data. Select multiple matches to combine stats across games.
Customize Stat Columns
For a full spreadsheet view with customizable columns, click the expand icon (between the Filters button and X in the top bar) to open full-screen mode.
Click the settings icon in the top-right corner of the table.
In the Customize columns panel, drag groups to reorder them or uncheck a column to hide it.
Filter Stats
Click the Filters button in the top-right corner to narrow down data by player, skill, or situation.
Export
Click the Export button in the top-right corner to download your stats as a .csv file. (You must be in full-screen mode to export.)
The Box Score report provides a quick summary of team and player stats from a game, making it easy to quickly see who played well and where the game was won or lost.
Click the Reports icon in the right sidebar.
Select the Box Score tab.
Click any underlined stat to view the video for those stats.
Attack Tendencies provide a visual and statistical breakdown of where and how attacks are happening, helping coaches and athletes identify patterns, strengths, and opportunities for improvement.
View Attack Tendencies
Click the Reports icon in the right sidebar.
Select the Attack Tendencies tab.
Select multiple match cards to load combined data across matches.
Choose a visualization mode:
Lines
Distribution
Efficiency
The visualization can be filtered by result: Kill, Error, or In-Play. Use the Filters button to narrow by player, skill, or situation. Click Export to download the data as a .csv file while in full-screen mode.
The Rotations tab shows a breakdown of your team's attacking performance in each rotation, combining stats and court visualizations in one view.
Set Up Rotations
Before rotation data will appear, you'll need to add your starting rotations.
Click the Reports icon in the right sidebar.
Select the Rotations tab.
Click Add starting rotations and set the serve/receive and rotation number for each set.
View Rotations
Once rotations are set, each of the 6 rotations is displayed as its own card. Each card includes:
A stats table breaking down attacks by pass quality (Rating 3, 2, 1, and Total) per attacker, showing Total Attacks (TA), Distribution % (Dst%), and Attack % (Atk%).
A court diagram showing attack trajectories, with a legend for Kill, Error, In Play, Clean Attack, and Deflected Attack.
Setter Tendencies visualize where your setter is distributing the ball and how effective each zone is, helping coaches identify patterns and plan strategically.
Click the Reports icon in the right sidebar.
Select the Setter Tendencies tab.
Select multiple match cards to load combined data across matches
The left side shows a zone heatmap — a 3×3 grid of the court displaying Kill%, Attack%, and number of attempts per zone, color-coded from low to high efficiency. Switch between Efficiency and Frequency views using the tabs above the heatmap. Filter by phase: All Phases, First Ball, or Transition.
The right side shows a Setter Tendencies Details table with Involvement and Sets stats per player, including Set Attempts, Set%, Assists, and Setting Efficiency. Click Export to download the data as a .csv file while in full-screen mode.
The 3D tab visualizes attack contact heights in a realistic on-court environment, helping coaches and athletes understand how attacks are being hit and blocked.
Click the Reports icon in the right sidebar.
Select the 3D tab.
Select the matches you want to include in the report.
Use the metric drop-down in the top-right corner to choose what to visualize (e.g., Attack Heights).
Use the unit toggle (ft/in) to switch between imperial and metric measurements.
The legend shows attack results: Kill (blue), Error (red), and In Play (white).