Measuring Throw-In Success

In the 2023/24 Premier League season, there were an average of ∼35 throw-ins per game. Roughly 25% of them were in the throwing team’s defensive third, and the remaining 75% were more or less evenly shared between middle and attacking thirds.
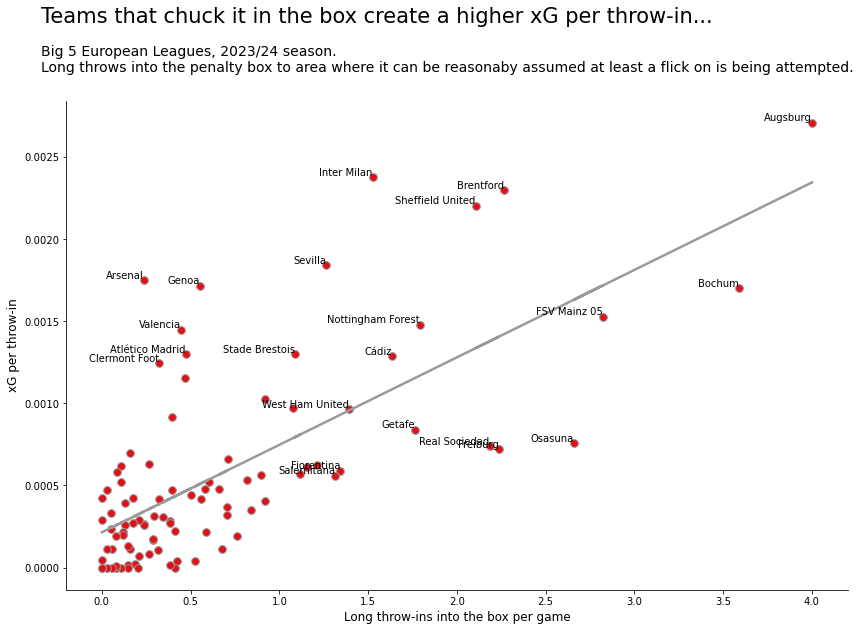
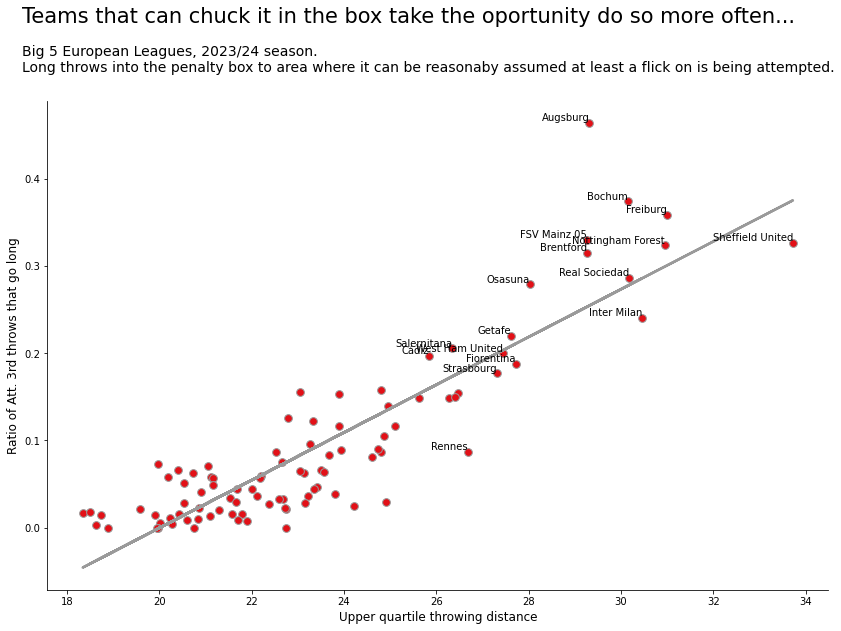
Obviously if you have the tools at your disposal then there’s no shame in getting the ball directly into the most dangerous of danger zones - in fact if you’re not doing so then the above tentatively suggests you’re actively leaving something on the table. But if you don’t have that skill set at your disposal, it doesn’t mean you’re objectively bad at throw-ins. There is also an artistic element to maximising the effectiveness of these restarts, so decoupling from the rawness of being able to throw the ball far has some value.
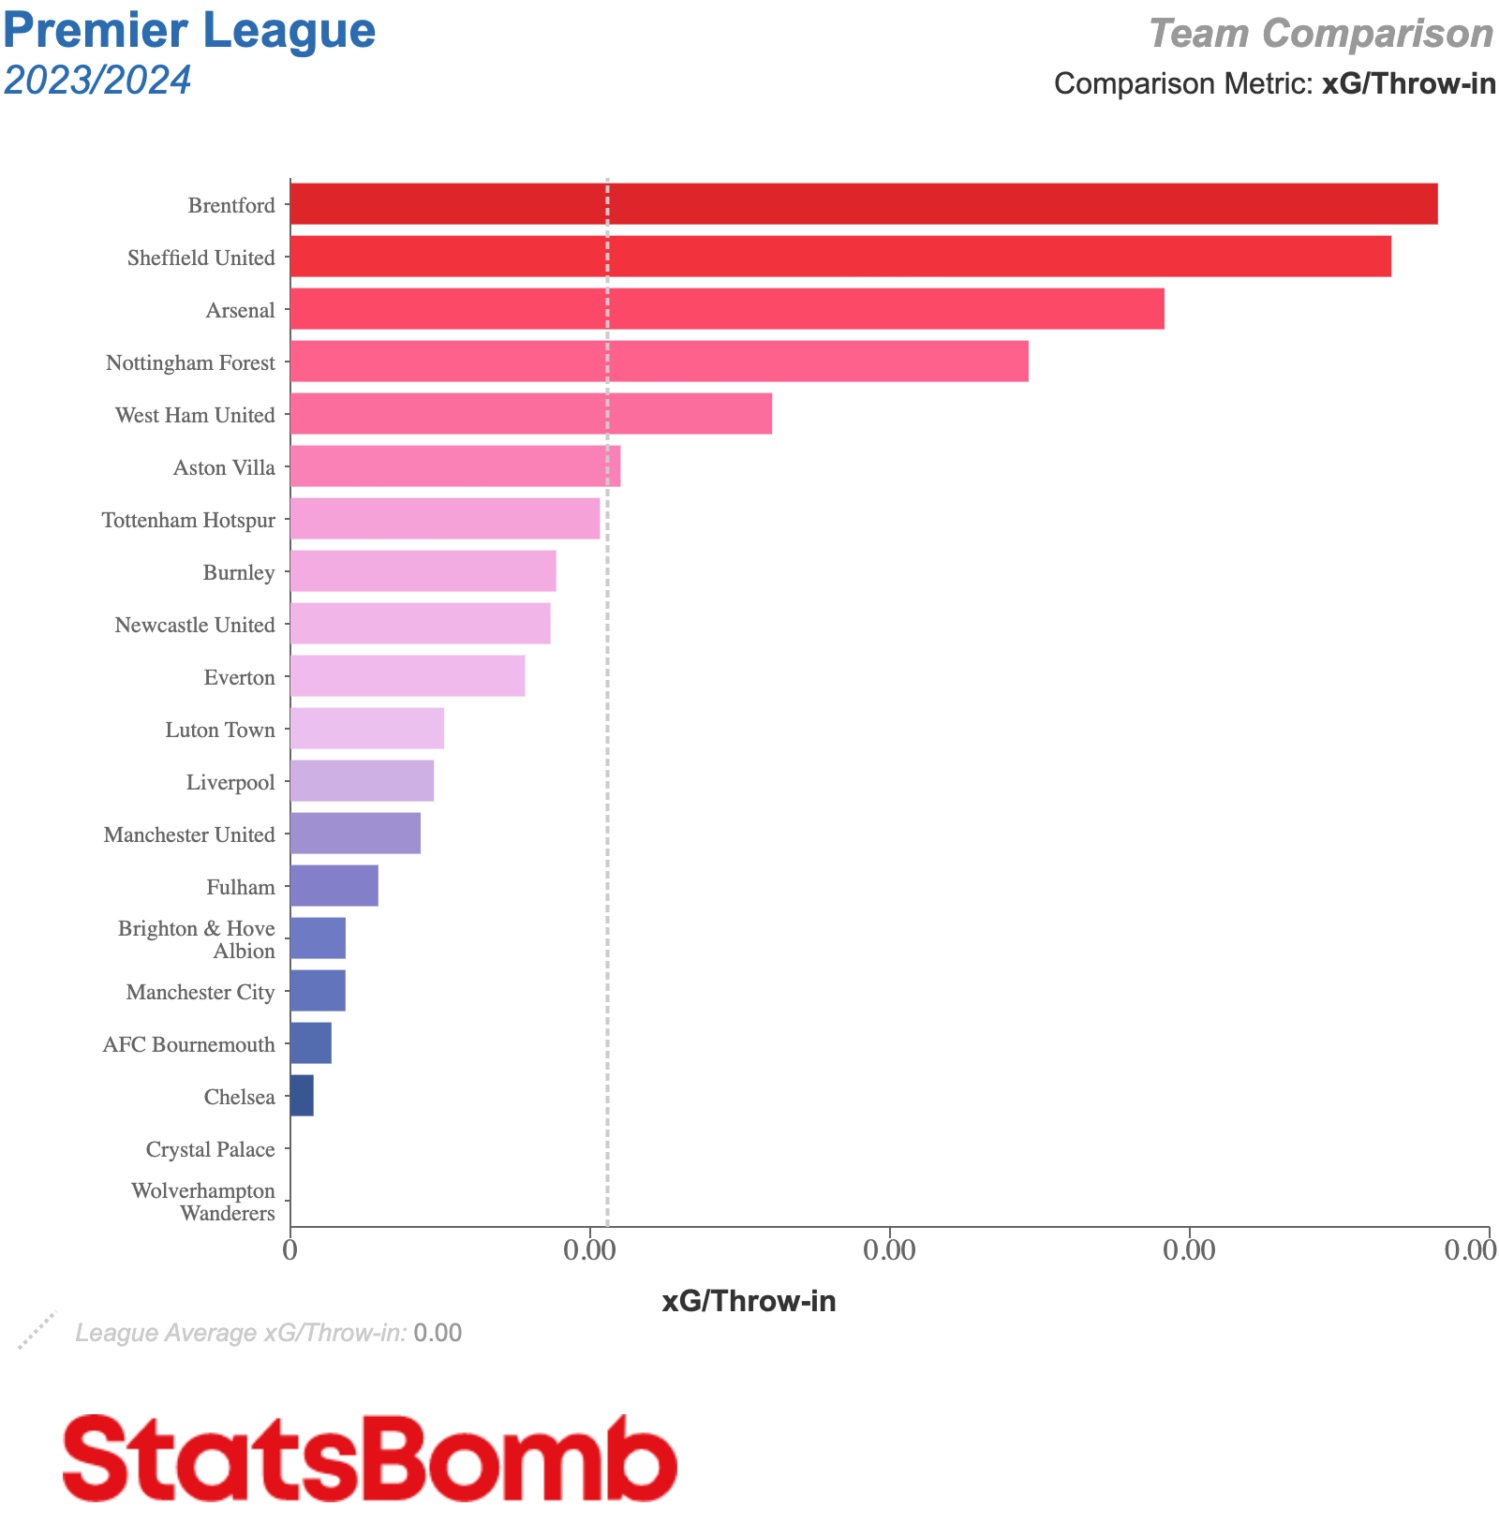
To that point, interesting here are the likes of Arsenal, Genoa, Valencia and other named teams in that left side area, who are each in the upper quartile of teams by xG per throw-in, but relatively rarely execute long throws into the heart of the penalty box.
OBV
In order to remove the requirement to generate a shot within the throw-in phase of play (i.e. an xG value) to achieve some recognition, we can instead look at On-Ball Value (OBV).
There are numerous ways to approach this, but my chosen method is to calculate the difference between the OBV value of the throw-in and the highest OBV end state of any action in the subsequent 5-seconds.
By doing this, we capture the biggest increase in your chance of scoring within the subsequent passage of play, even if you subsequently regress into a less threatening state, and we’re also not discounting scenarios where a team may momentarily lose possession then regain it. Admittedly, the 5-second timeframe is slightly arbitrary, but it falls in line with the measurement used for metrics such as Pressure Regains and High Press Shots, and it feels like a fairly reasonable cut off for when any team’s advantage (or disadvantage) from a throw-in set up might have ended. Furthermore, after looking at a few leagues and adjusting the cut-off by 2-3 seconds either side, the differences in rankings were arbitrary. 5 seconds it is.
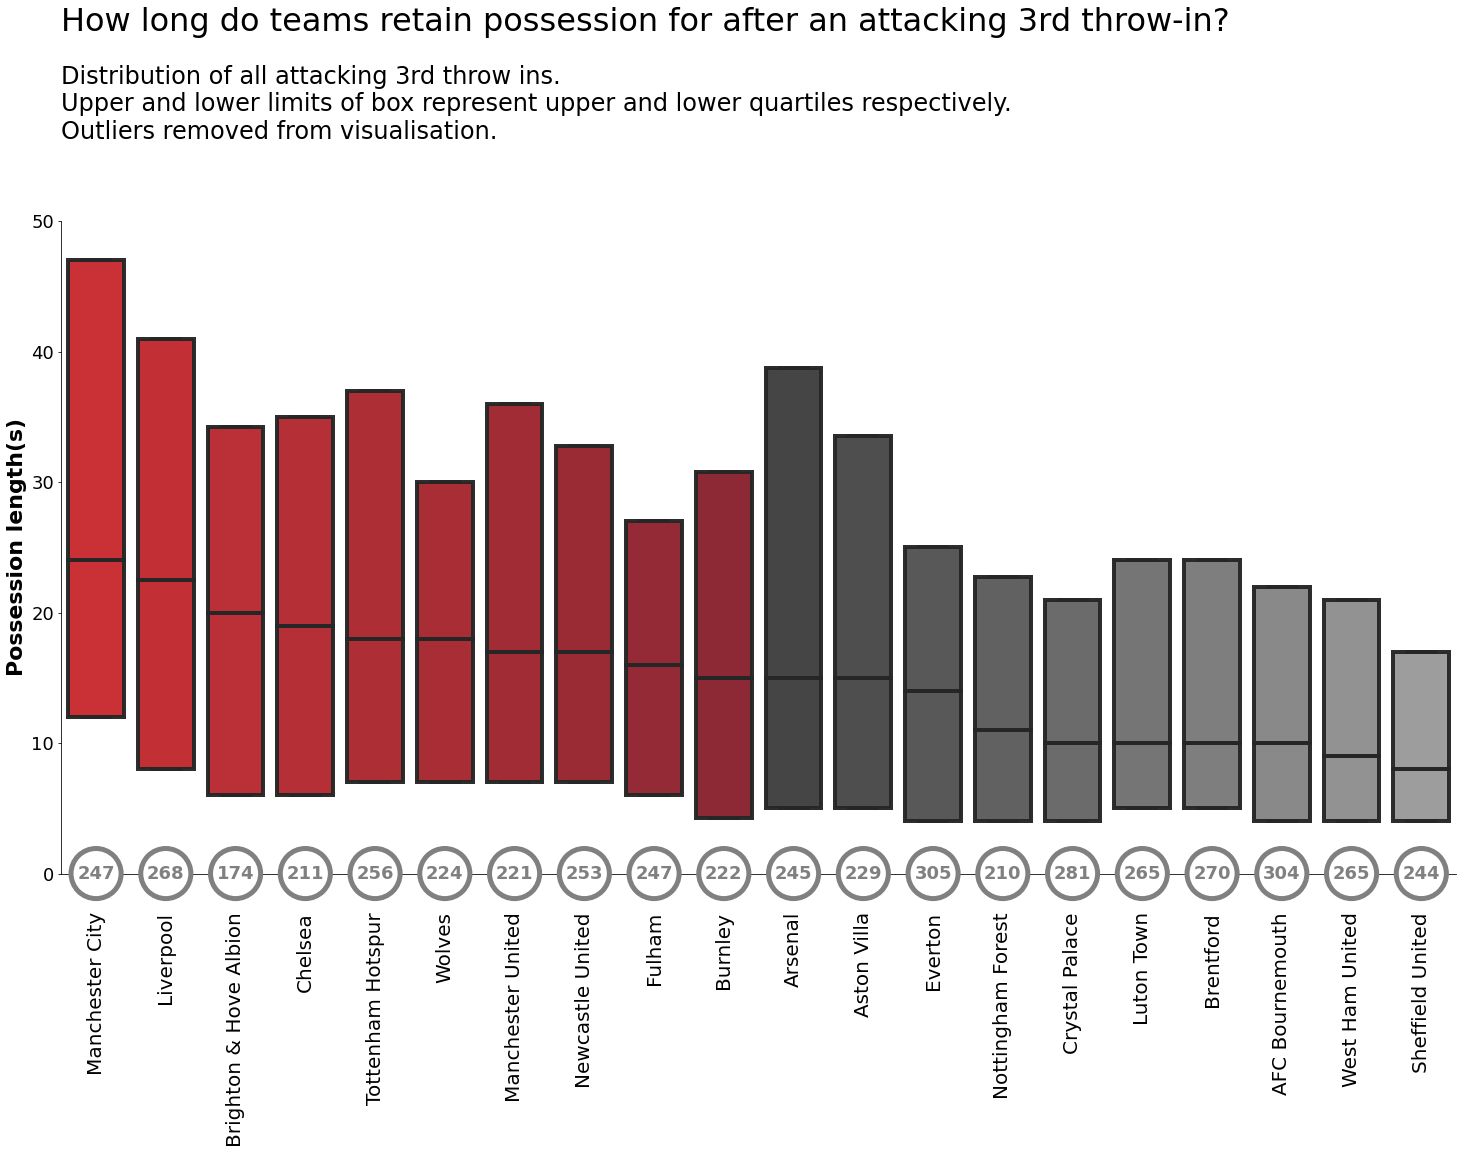
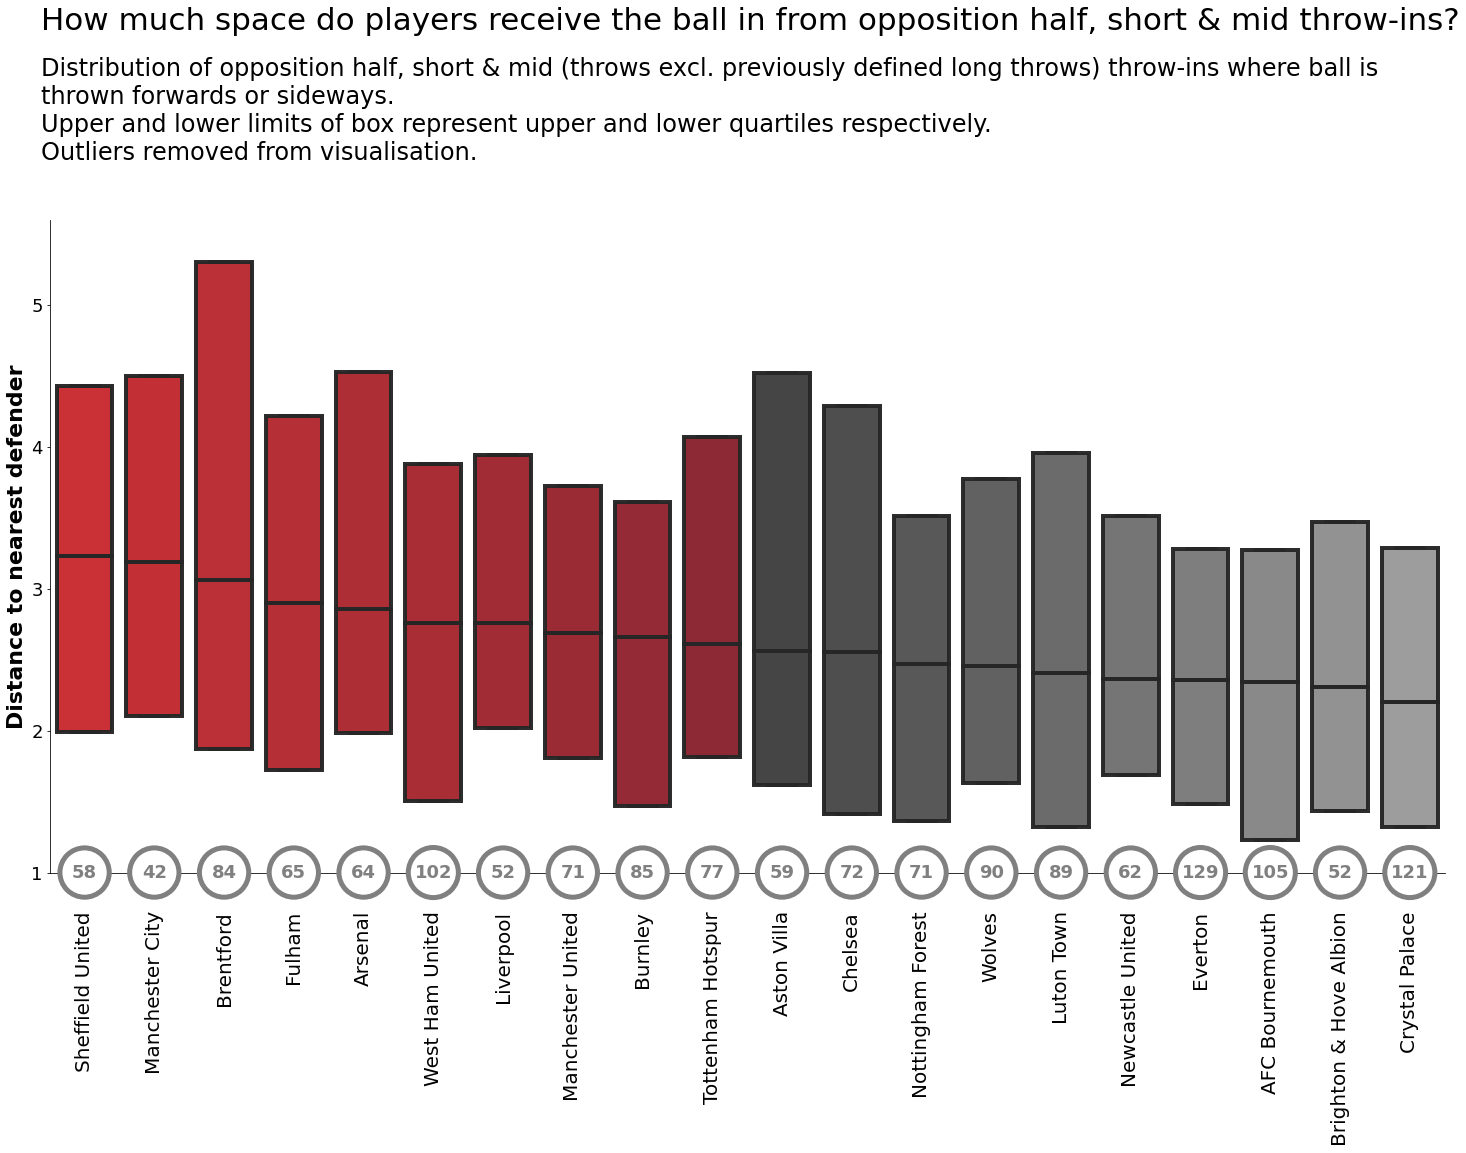
The results below are ordered by the median OBV value of all attacking 3rd throw-ins, and the top and bottom of the bars represent upper and lower quartiles. Numbers inside the circle are a count of the number of throws being considered.
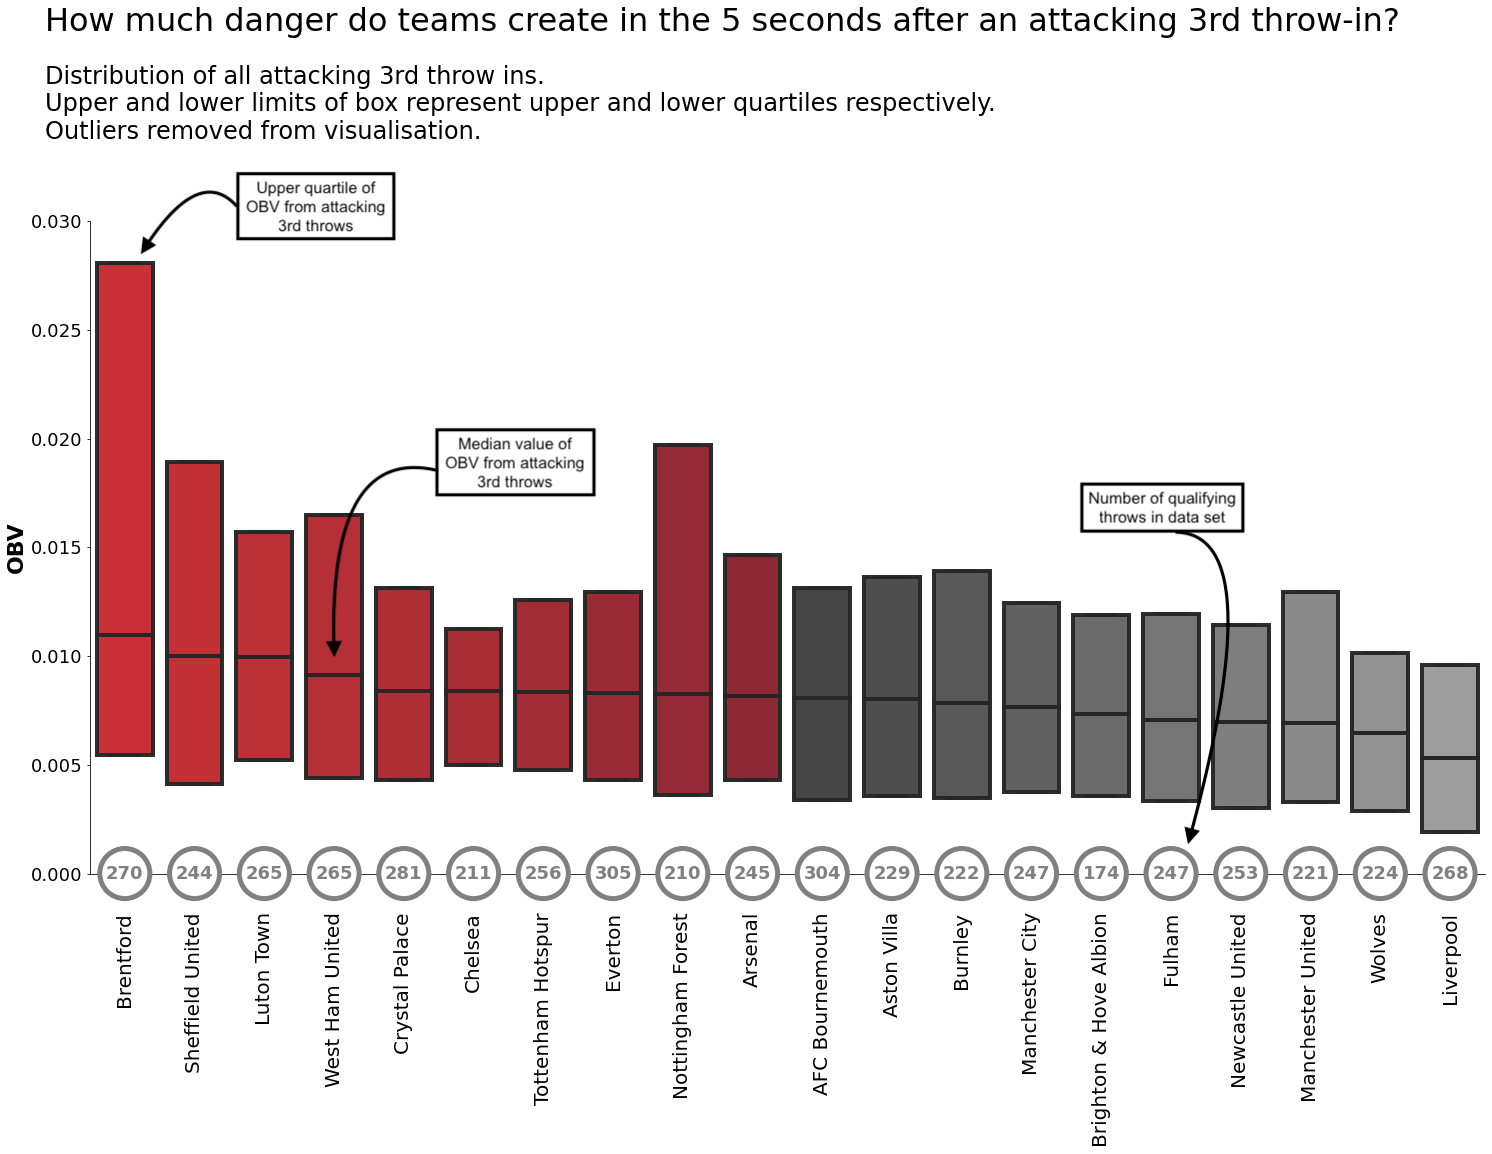
Brentford and Sheffield United still come out on top, as they do with xG - and this is likely still somewhat weighted to the long-throw into the box traits - but there’s also a clear top-heavy nature to Brentford’s distribution that suggests there’s something a little more going on there. Nottingham Forest are an interesting case too - overall they‘re middle of the pack, but they clearly possess a threat when things click.
Luton, Palace and Chelsea also feature much more prominently here than they do on the xG measure; is there a disconnect between moving the ball into dangerous areas, but not getting a shot on goal?
And then high-possession (and generally stronger) teams in the league like Liverpool, Man City and Brighton are each struggling to make an impact on this metric. This point stands even when you remove long throws from the equation.
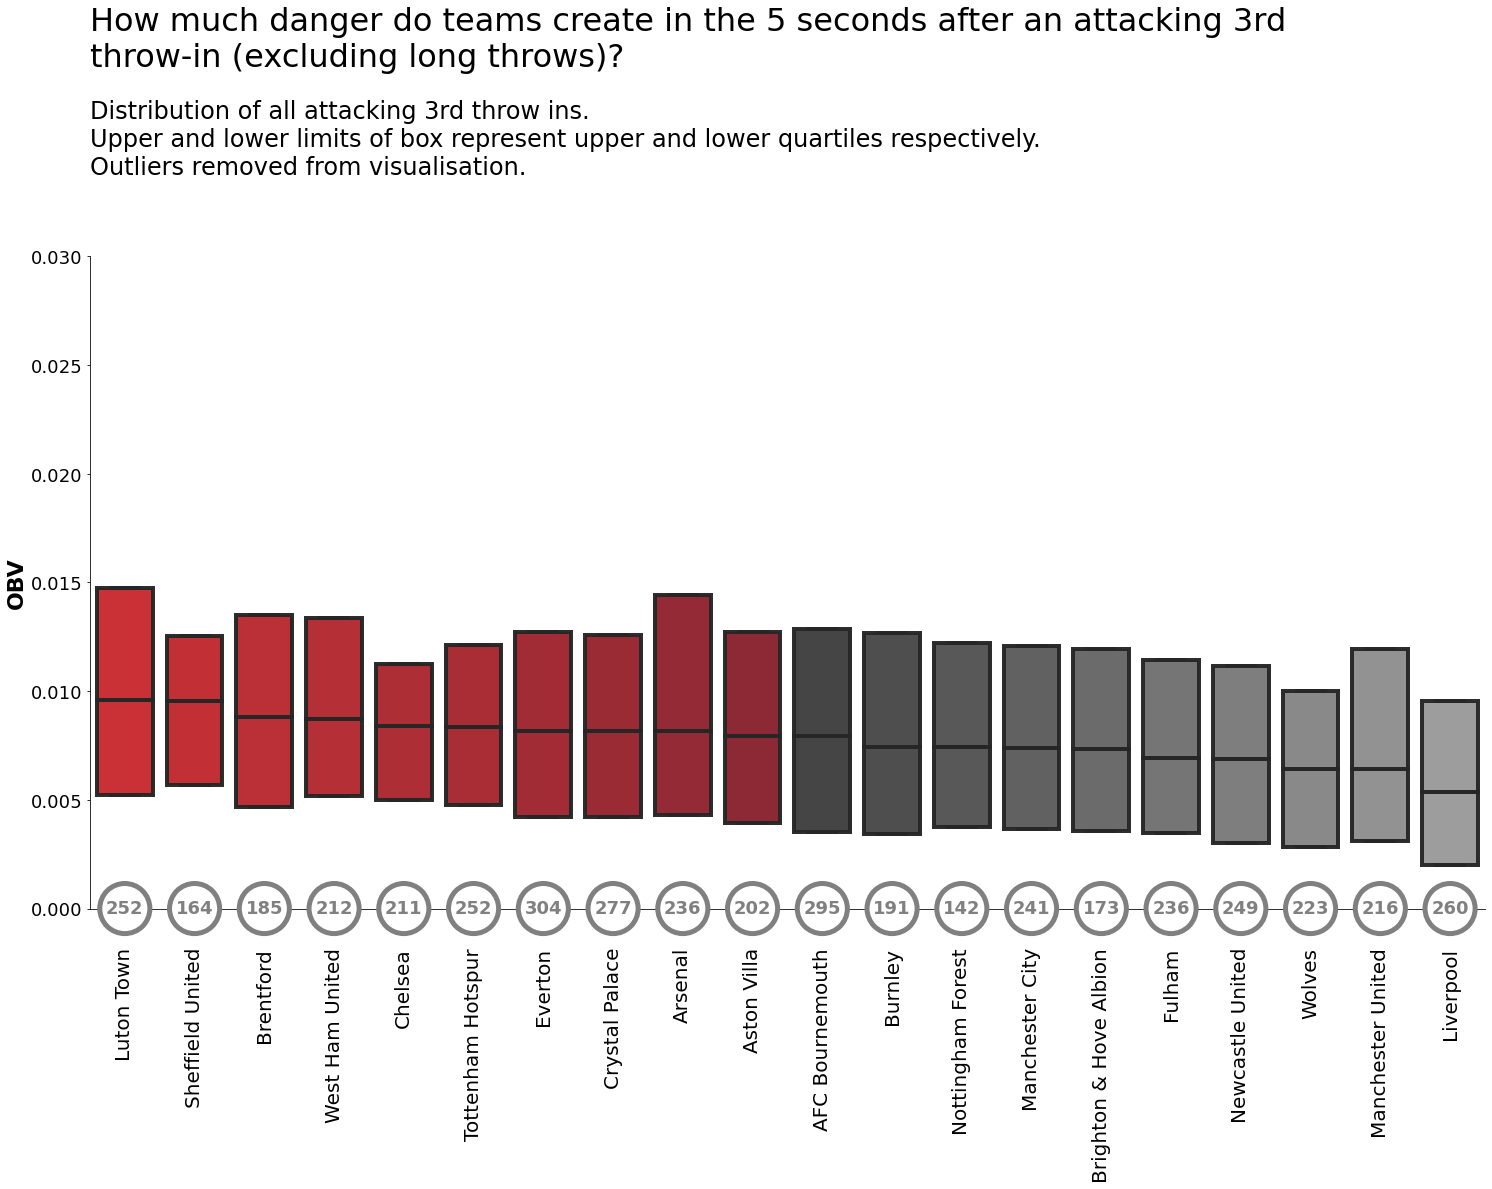
Although the differences are less pronounced here, let’s acknowledge that both Sheffield United and Brentford are not simply long-throw merchants. And yet another tip of the hat to Luton and Crystal Palace - further analysis would be required, but there’s an inclination that they may be creating crosses into the box shortly after throws, and that is generating the higher OBV values.
Possession length
It would be remiss to suggest that because Liverpool, Man City and Brighton don’t rank well for xG or OBV from throw-ins that they are objectively bad in this area - you don’t gain the reputation of Jurgen Klopp or Pep Guardiola by leaving something on the table - so they must be doing something else.
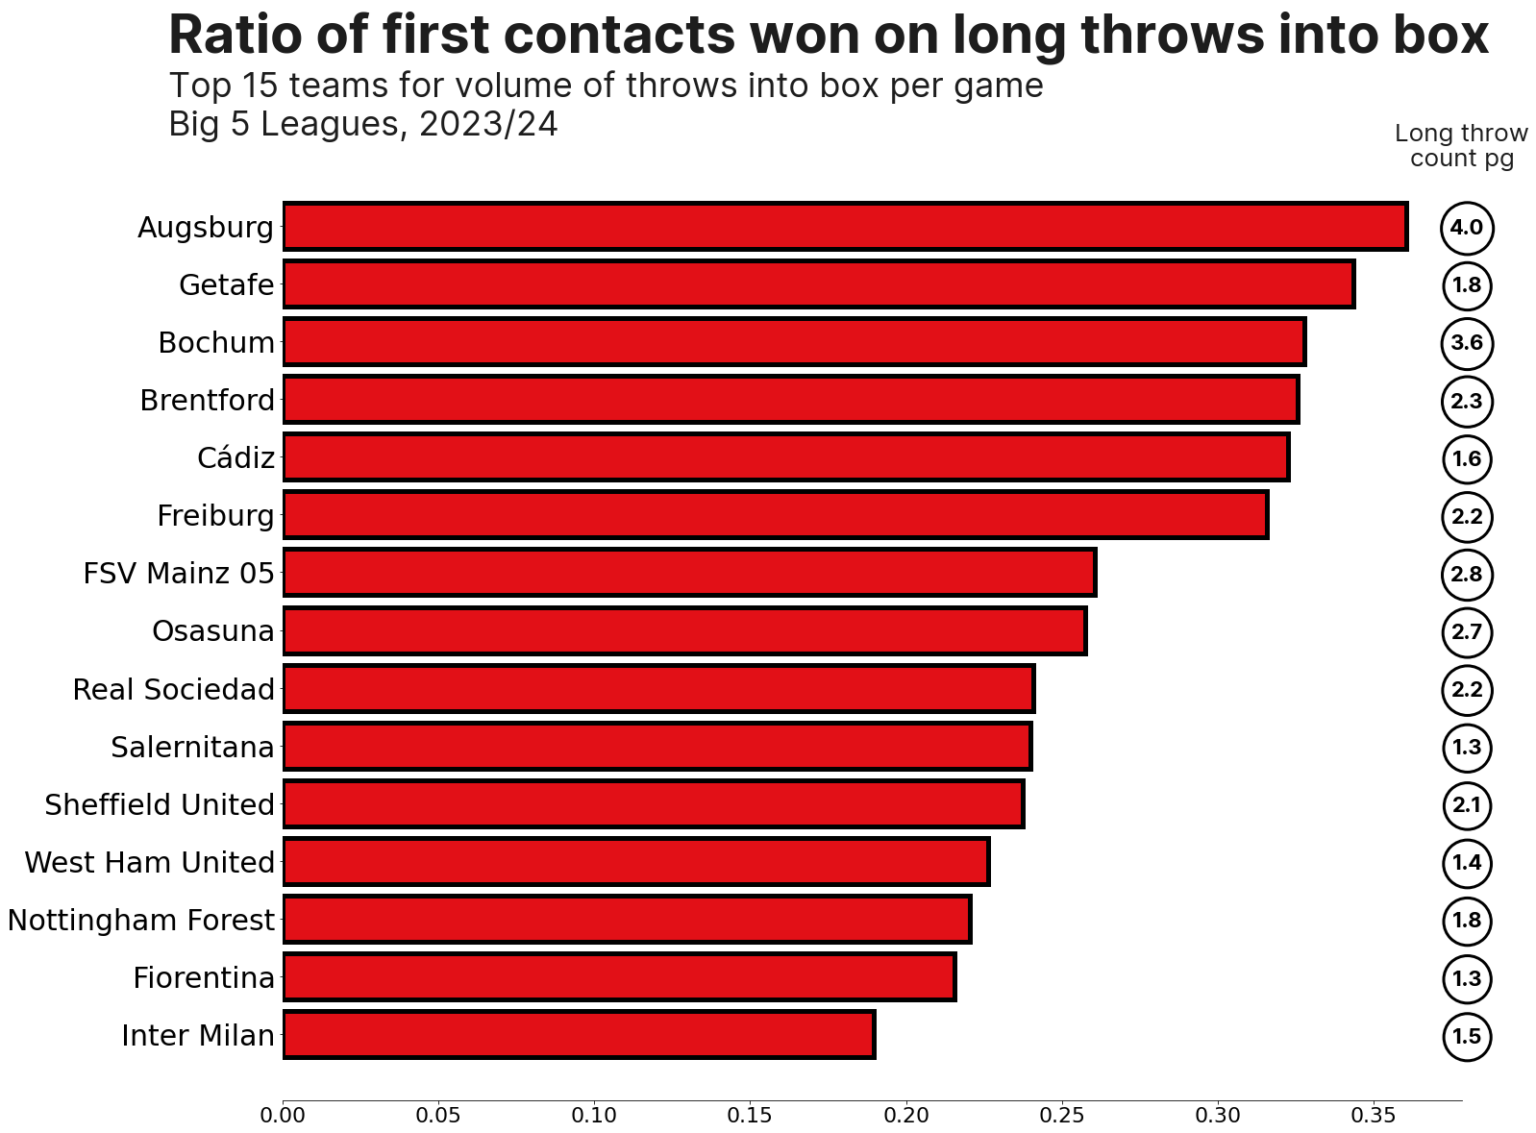
Augsburg and Bochum are interesting, stand-out cases here - they regularly throw it into the box AND are very good at winning first contacts. Brentford’s proficiency for winning first contacts is also telling and undoubtedly linked to their reputation of being a potent threat from attacking throw-ins.
And for the final word on the big throws into the box, a quick look at who the rocket launchers of these so-called hand-corners are. For the same reasons outlined above, I’ve focussed on the upper quartile distances of long throws (short throws are discounted here), but I’ve also added in the distance of the longest throw from each individual because… well, err, it’s fun to see.
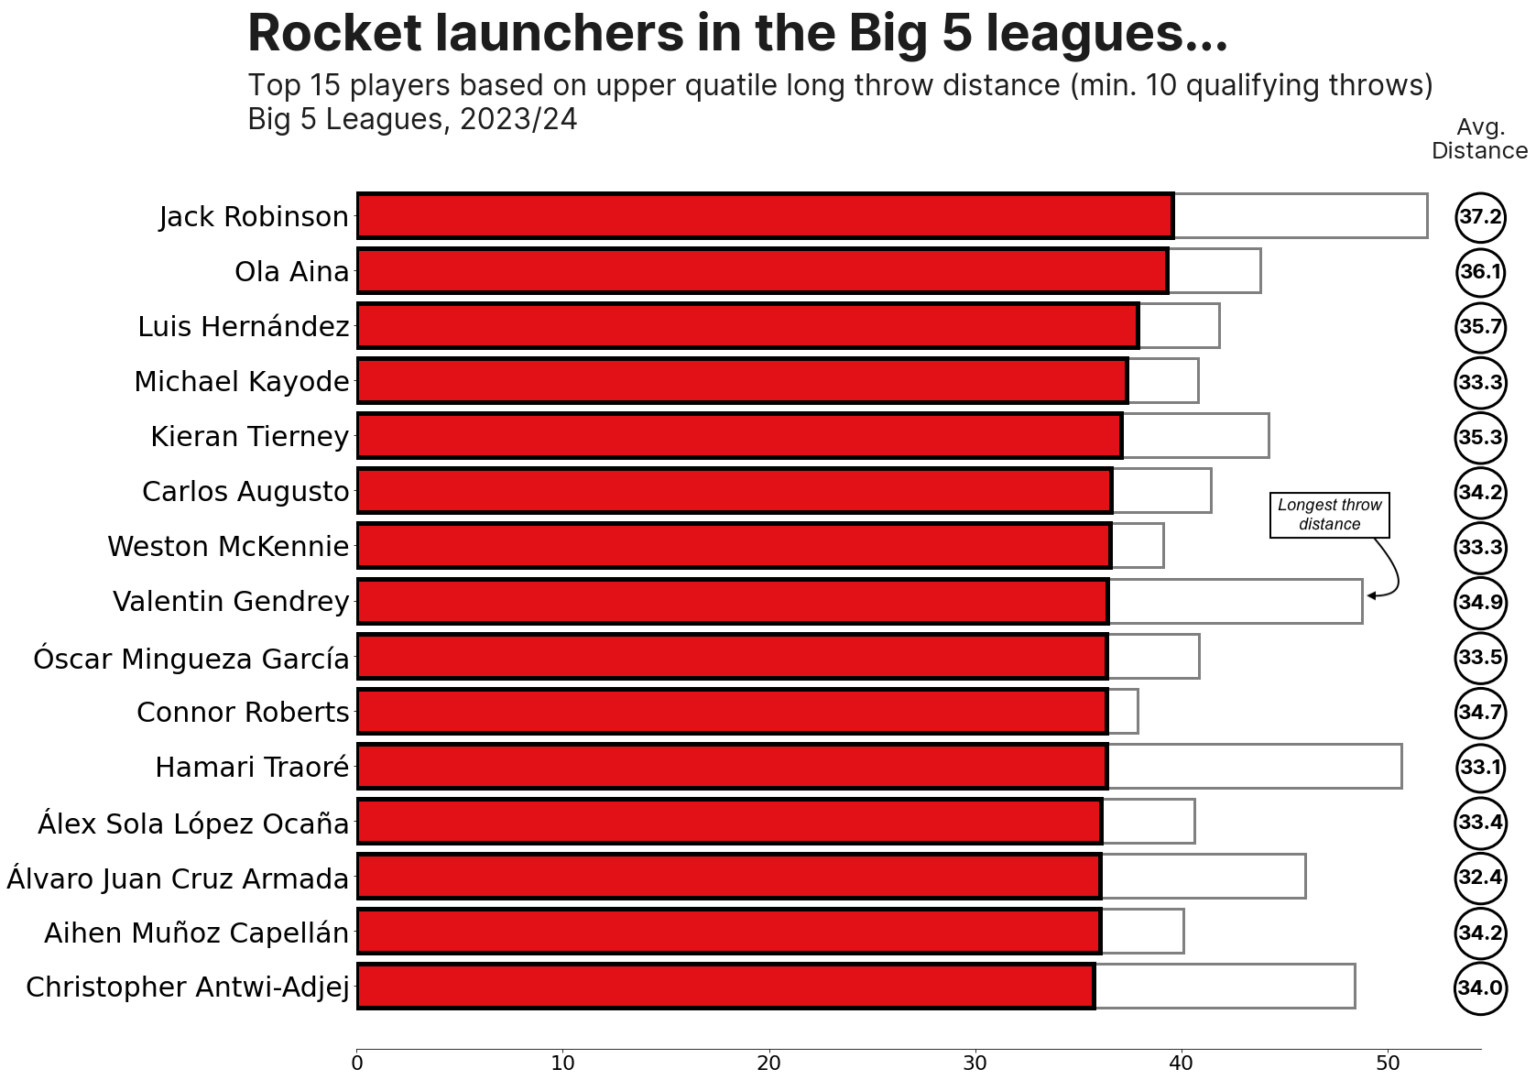
Notable here is that both Sheffield United and Brentford feature prominently. Perhaps this is partly a consequence of opponents being wary of the long-throw threat, packing the box more than they would normally, and the throwing team then taking advantage of space that has been allowed. In addition, Brentford again have a high upper range, which further enhances their reputation as throw-in innovators (throw-innovators? - sorry).
At the opposite end of the scale Brighton are an interesting case; we’ve already seen that they create very little xG or OBV (in the subsequent 5 seconds) from throw-ins, and although we’ve seen they are capable of retaining possession, this does tie in with Roberto de Zerbi’s known indifference to training set pieces.
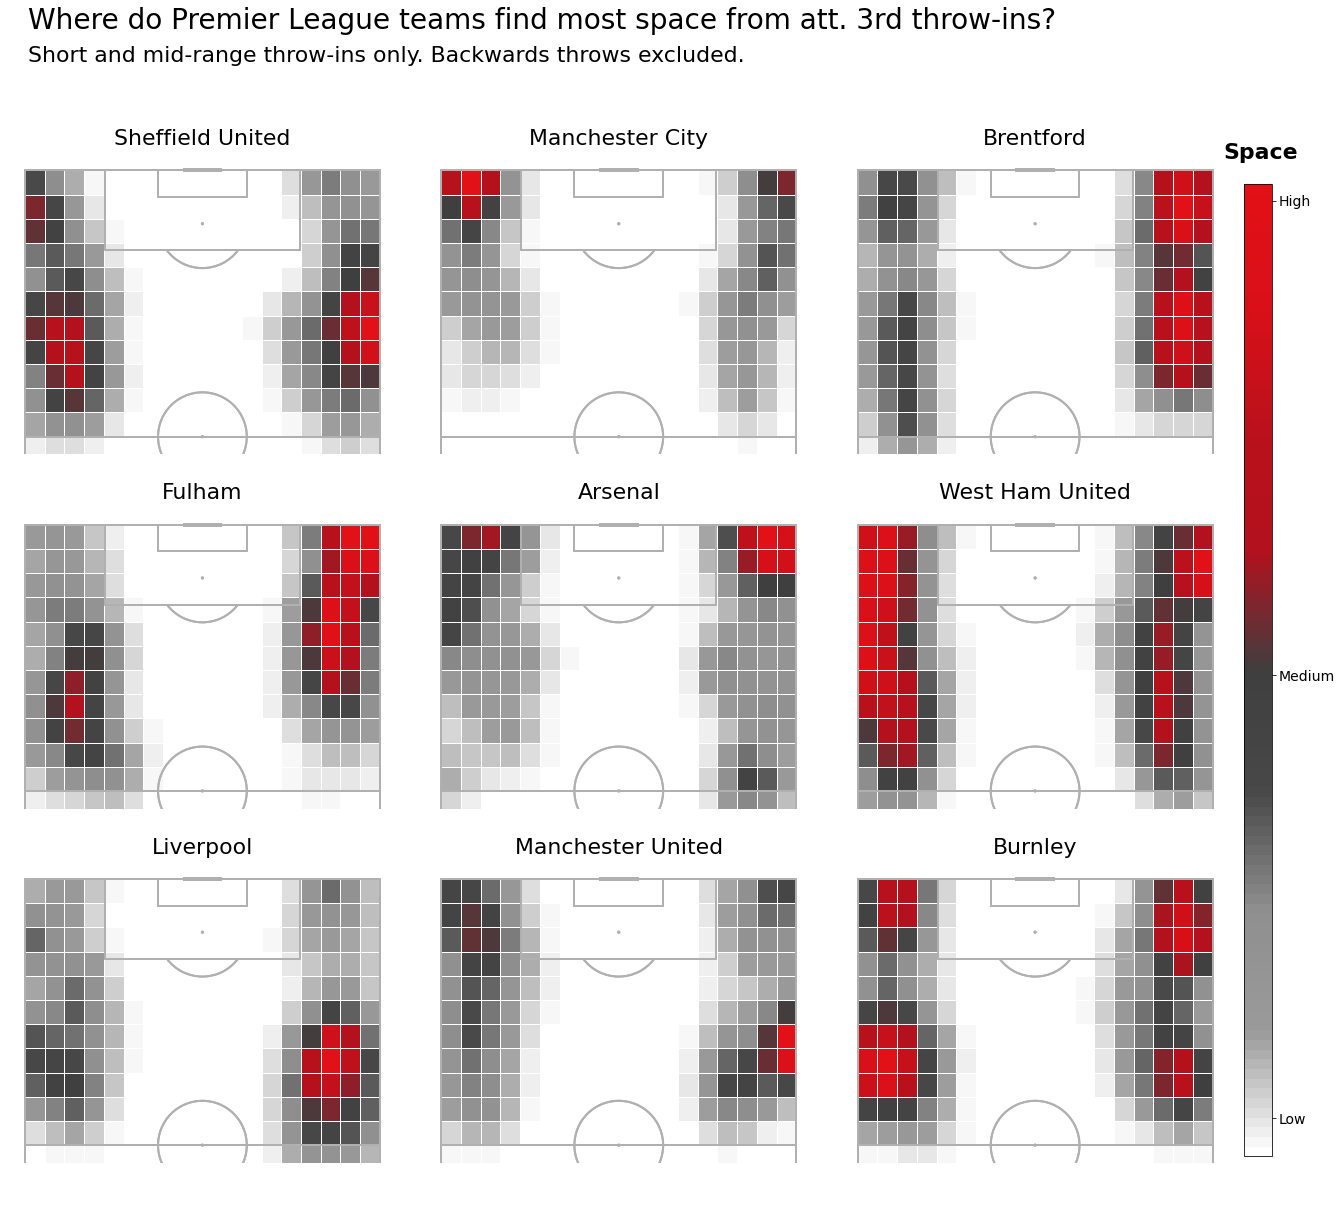
Now that we know which teams create the most space, how about looking at where they create that space?
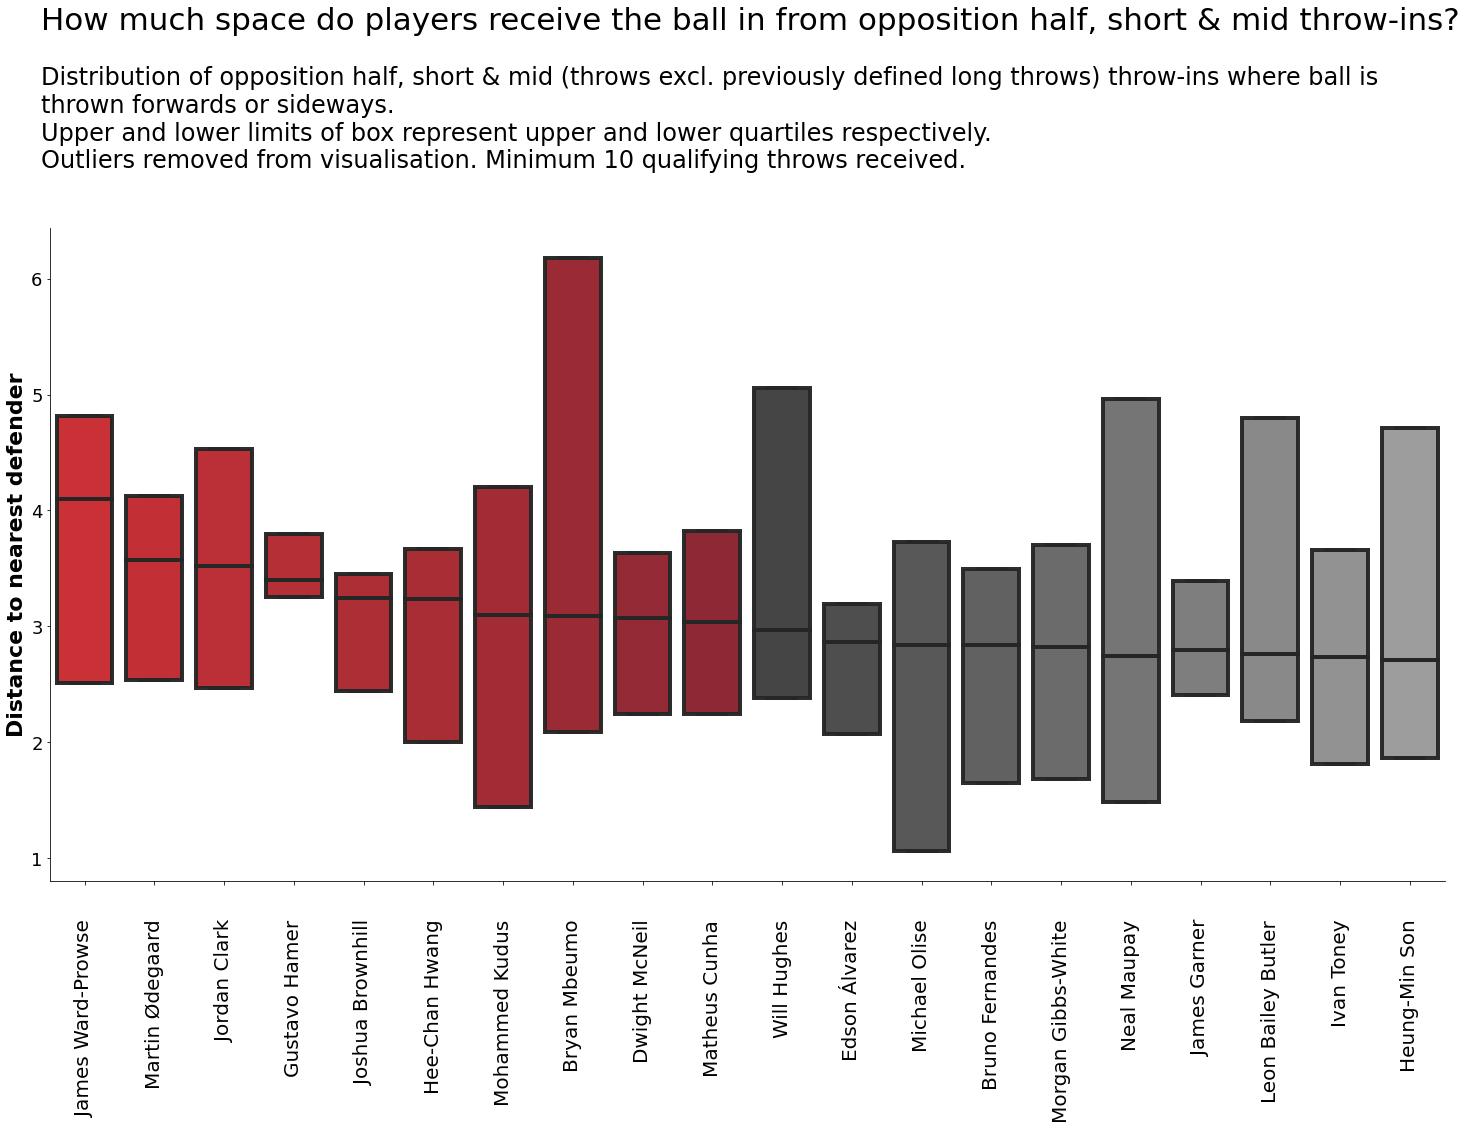
Note Mbuemo’s ability to regularly find larger pockets of space that ties in with Brentford’s right-side proficiency. Gustavo Hamer stands out as the Sheffield United midfielder that is the one regularly finding the mid-range pockets of space in the midfield area. And a nod to Will Hughes who has a big upside on his range of space, despite playing in a Crystal Palace side that has the lowest median when measured by team.
In Conclusion
Throw-ins are rarely sexy, in fact they’re undoubtedly the ugly sister of the set-piece family - yes, even goal kicks are more glamorous these days. But it’s for that reason that there is an edge to exploit if teams opt to do so.
Without the context of knowing what the aim is, it’s difficult to explicitly say that any one team is best in class at something as nuanced as throw-ins. However, it’s fairly evident that Brentford are doing something over and above what others are in the Premier League when it comes to their attacking throw-ins. And that Arsenal adopt a more varied approach than their peers at the top end of the table.
All that said, the above is not an attempt to highlight one particular team or method. Instead I hope it serves as some sort of pointer to the myriad of ways in which you can measure and analyse not just throw-ins, but any of the finer details of the game.
Of course everything that happens on a football pitch should ultimately be an attempt to increase your chance creation metrics, or suppress those of the opposition, but how you get to those end goals is a matter of choice. And I’m a big believer that in sport, anything that you choose to do should be monitored, analysed and measured, where possible.