Smarter Game Prep Starts With Hudl IQ’s Defensive Tools
Hudl IQ’s defensive tools simplify complex data into clear, actionable insights that give coaches a strategic edge in scouting opponents and game planning.
Hudl IQ defensive tools go beyond traditional stats and put the trench battles under a microscope. Defensive coaches get instant clarity on pressure rates, run fits and protection breakdowns, all of which don’t appear in traditional box scores.
With tools like defensive radars, havoc charts, tackle maps and line pressure data, coaches can pinpoint where plays break down, adjust schemes and outmatch opponents at the line of scrimmage.
Here’s a quick look at Hudl IQ’s defensive tools and how coaches get the most out of them.
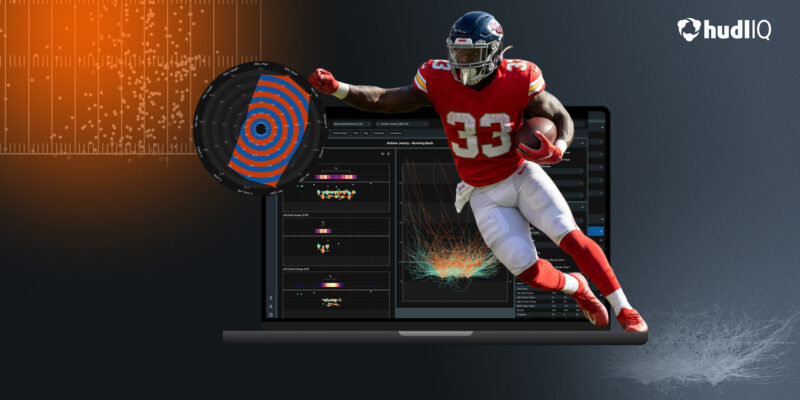
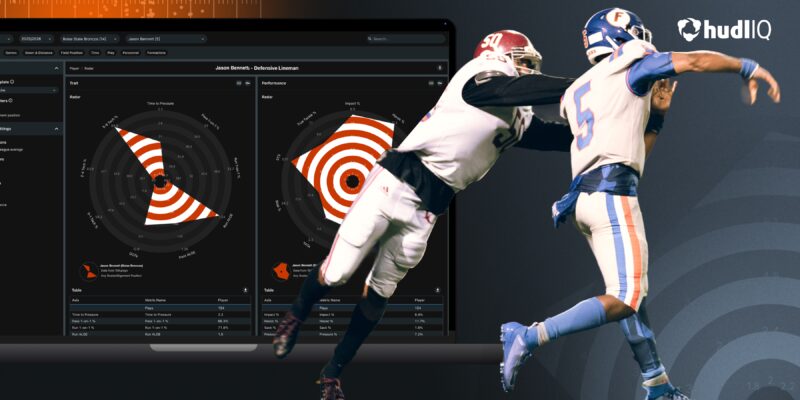
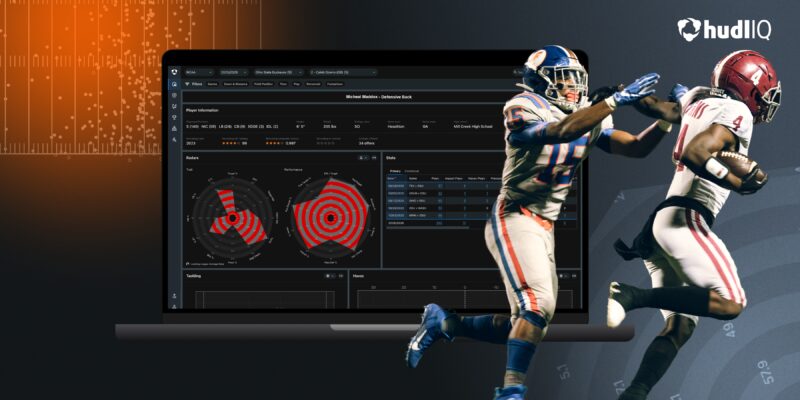
Defensive Radar. Hudl IQ radars use specific stats and metrics to provide a comprehensive overview of team and player traits and performance. These radars are a fast, visual way to see the full picture of a defense. Use them to spot patterns, identify strengths and weaknesses and make data-backed adjustments.
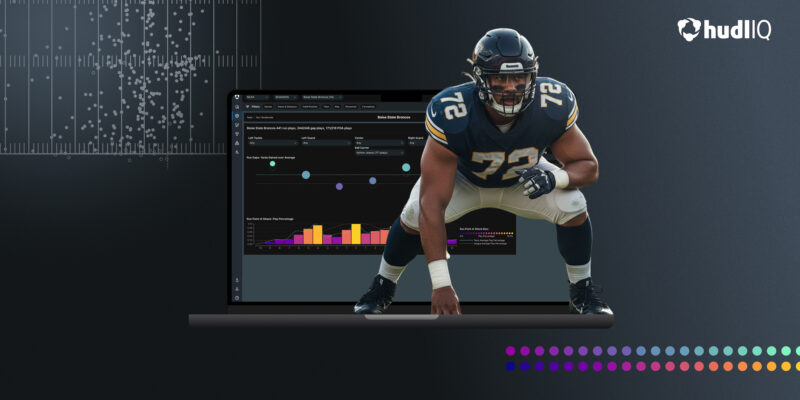
Defensive Scheme. Use the defensive scheme section to examine front, blitz and coverage, and find additional information on success rate, yards per rush, yards per pass and more. Get the data you need to see the full picture of a defense and pinpoint which combinations are working.
Depth Chart. The Hudl IQ depth chart gives coaches an instant overview of what players have played the most snaps, percentage of snaps on the field and sheds light on top personnel groupings during high leverage downs.
Passing Chart. The Passing Chart helps coaches see between the numbers, revealing not just where teams are throwing the ball, but how and why. Go beyond completions to uncover deeper patterns in pass location, coverage and outcomes. Analyze air yards per attempt and completion, then filter by game, situation or field location using heat maps and color-coded paths.
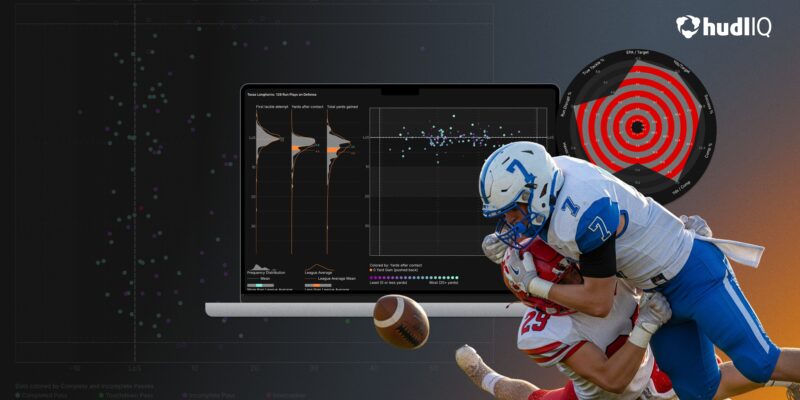
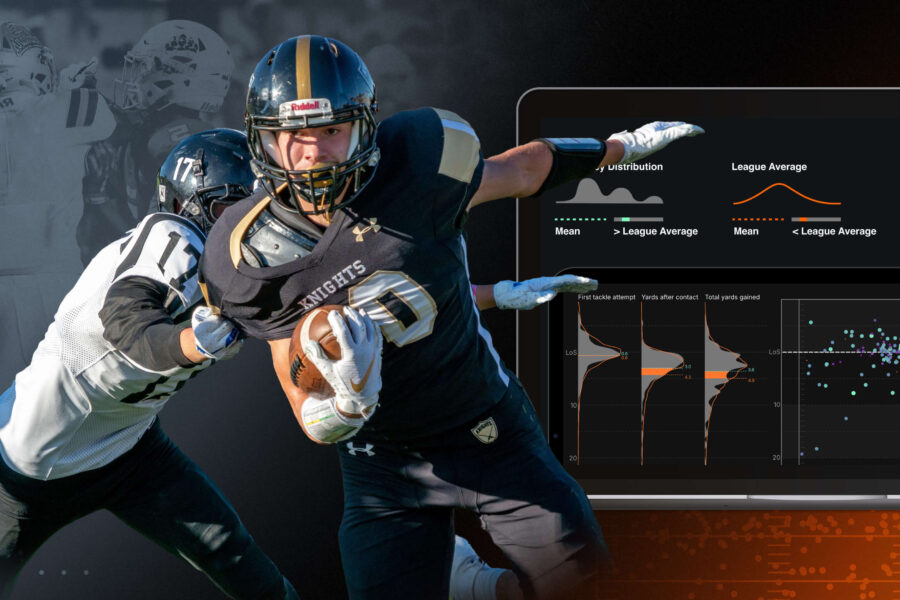
Tackle Map. The Tackle Map shows where tackles start and whether a tackle was successful or not. Use this tool to see metrics like first tackle attempt, yards after contact and total yards gained. Get the data to understand who your most sure tacklers are to ensure you don’t miss a tackle in the game’s pivotal moments. In contrast to basic tackling stats, this tool provides the level of detail needed to fix missed assignments and ensure more secure tackling in critical moments.
Havoc Chart. The Havoc Chart helps visualize and quantify a team’s ability to force negative plays on defense. Use the havoc chart visualization to see exactly where and how your defense is creating negative outcomes. Coaches can use this tool to identify big-play personnel and identify hot zones that can be used to inform future game prep.
New to Hudl IQ or just need a refresher? Keep learning or book a quick chat with a Hudl expert, and we’ll show you what’s possible.