Hudl IQ helps coaches evaluate running backs with advanced stats on usage, snap distribution and run tendencies.
Running backs are tone-setters. They can pound out tough yards, slip tackles in space and turn broken plays into back-breaking gains. But great running back play is about more than just speed and power, it’s about vision, patience, footwork, alignment and the ability to finish runs with purpose.
With the Hudl IQ running back tools, coaches can go beyond the eye test and box score to get a comprehensive evaluation of running backs using advanced video and data. Whether you’re scouting opponents or evaluating players on your own depth chart, Hudl IQ brings clarity to one of the game’s most dynamic positions.
Here’s a quick look at Hudl IQ’s running back tools and how coaches are getting the most out of them.
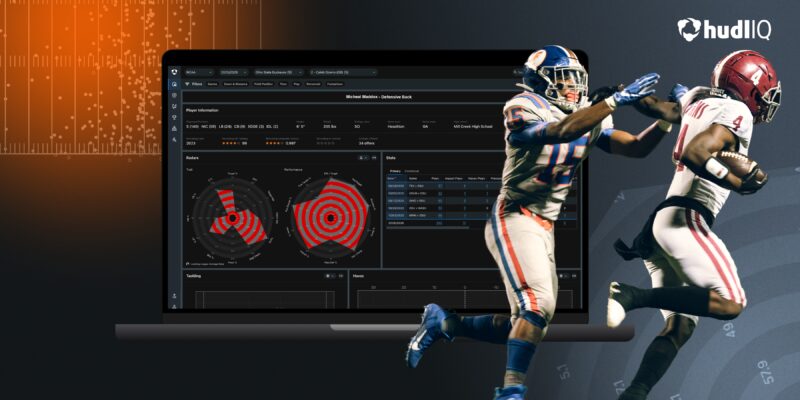
Player Information. Use the Player Information section to locate key details about the player, including a breakdown of alignment. Other details include height, weight, class, hometown, high school, recruiting class, Recruiting 247 ranking, Recruiting composite ranking and colleges offered.
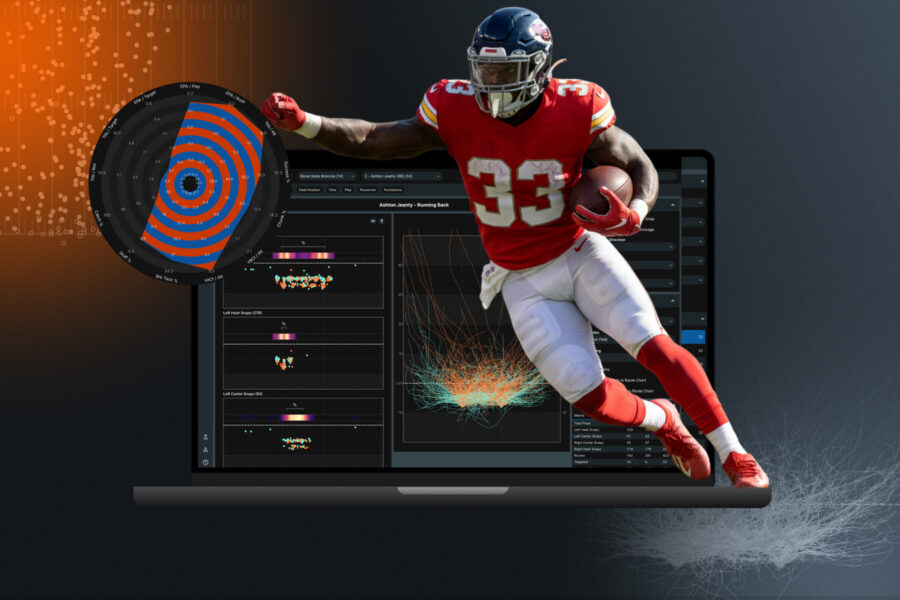
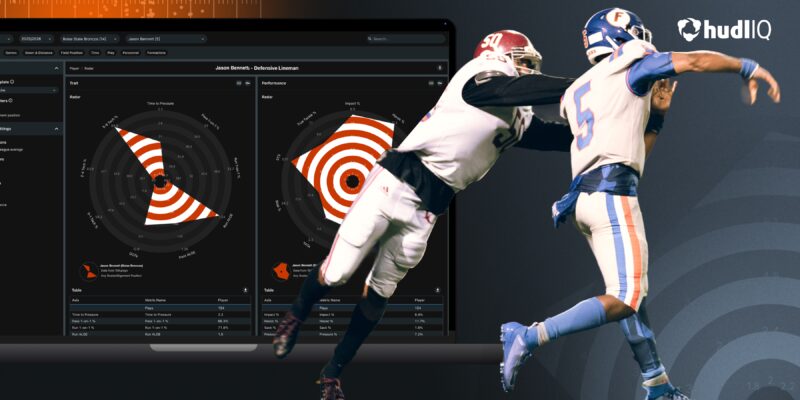
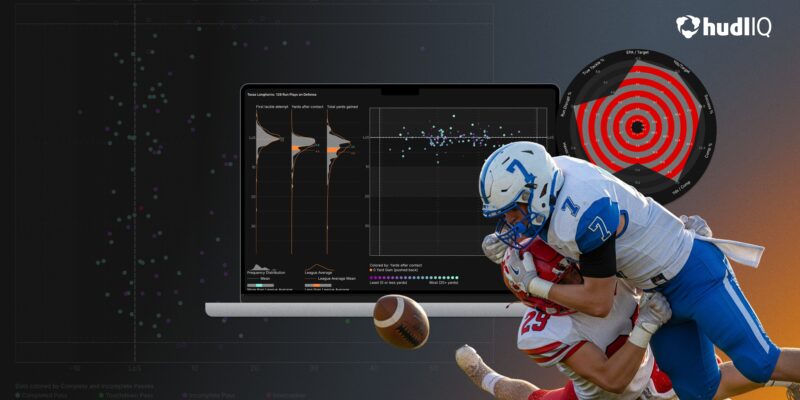
Player Radar. Hudl IQ radars use specific stats and metrics to provide a comprehensive overview of player traits and performance—all of which can be compared to national averages.
Use the trait radar to see how a running back is utilized in their offense’s scheme. See the Usage %, Route %, Depth of Target (DOT) and more.
Use the performance radar to get a clearer picture of on-field performance. See key metrics like EPA/Rush, Chunk %, Broken Tackle % and so much more.
Stats. Access a wide range of primary stats like rush attempts, rush yards, touchdowns and broken tackles, plus contextual advanced ball-carrier stats like EPA, EPA/Rush, Yards Before Contact, Yards After Contact, Chunks, Explosives and more to see how a running back performs in a particular game, over a stretch of games or an entire season.
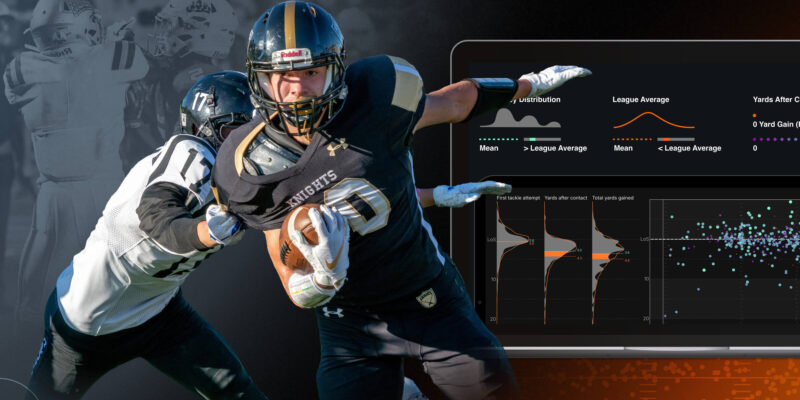
Tackling Map. The Tackling Map tool allows you to see player rushes and where they were tackled on the field. Identify things like how far downfield the first tackle attempt is, yards after contact and total yards gained.
Snap Distribution. The Snap Distribution tool gives you a clear, visual breakdown of where and how often running backs are lining up across the formation. See how often a running back lines up in the backfield versus the slot and identify patterns in routes, targets and performance based on alignment.
Passing Chart. The Passing Chart is a visual representation of passes thrown to that running back. Use the chart to determine things like depth of target, types of routes run and more.
Player Comparison. The Hudl IQ Player Comparison tool helps coaches evaluate two or more athletes side-by-side using advanced metrics, visual charts and tagged film. Use familiar player scores or self-select a list of players to compare that are statistically alike. This tool can be used to game plan against similar players or as a transfer portal tool to target statistically comparable players.
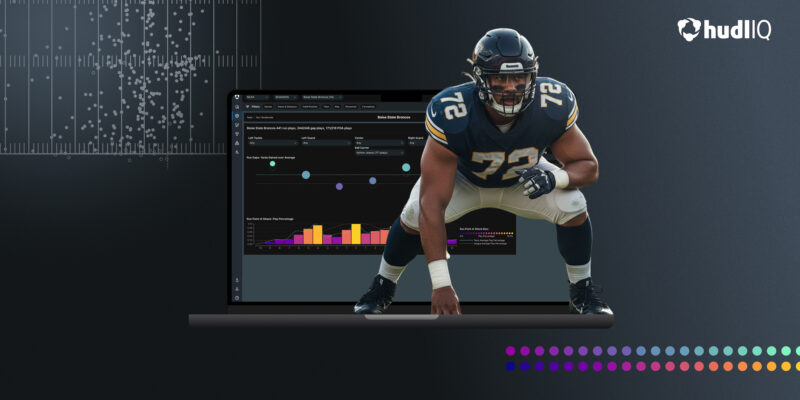
Run Tendencies. See every run attempted by gap, yards per run and success rate.
Hudl IQ’s player radars, run tendencies and yards-after-contact insights give coaches a deeper way to measure running back effectiveness—revealing who can keep the chains moving, finish runs and keep defenses off balance. With these new insights, coaches can better evaluate their backs, design smarter game plans and unlock more efficiency across the entire offense.