Hudl IQ helps coaches evaluate offensive linemen with advanced stats on success rate, pressures and run behind data.
Offensive linemen are the backbone of an offense. They can move the line of scrimmage, open run lanes, neutralize pass rushers and give quarterbacks time to throw. But great line play is about more than just size and strength—it requires elite footwork, communication, leverage and the ability to finish blocks for four quarters.
With the Hudl IQ offensive line tools, coaches can go beyond the eye test to get a comprehensive evaluation of offensive linemen using advanced video and data. Whether you’re scouting opponents or evaluating players on your own depth chart, Hudl IQ brings clarity to one of the game’s most dynamic positions.
Here’s a quick look at Hudl IQ’s offensive line tools and how coaches are getting the most out of them.
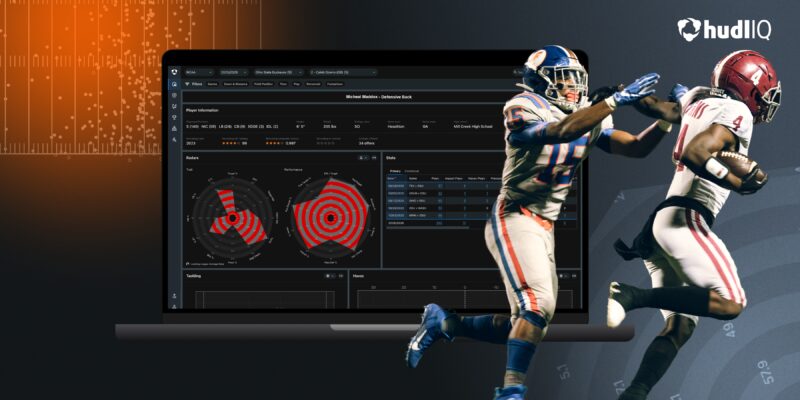
Player Information. Use the Player Information section to locate key details about the player, including a breakdown of alignment. Other details include height, weight, class, hometown, high school, recruiting class, Recruiting 247 ranking, Recruiting composite ranking and colleges offered.
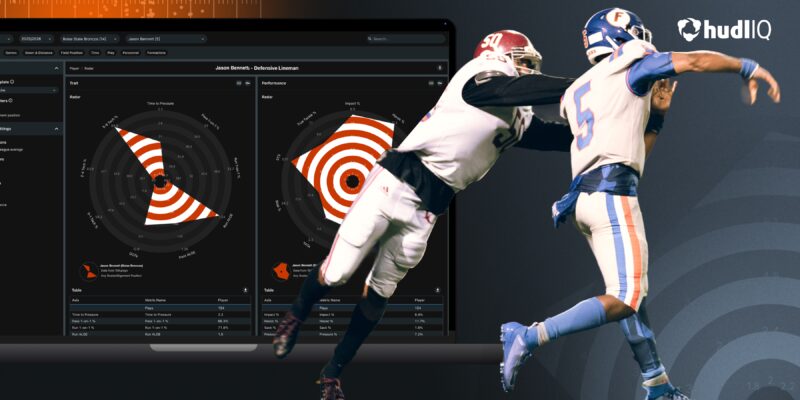
Player Radar. Hudl IQ radars use specific stats and metrics to provide a comprehensive overview of player traits and performance—all of which can be compared to national averages.
Use the trait radar to see how an offensive lineman played the position. See the Time to Pressure, Pass and Run ALOE (Average Length of Engagement), Pass and Run 1-on-1 % and more.
Use the performance radar to get a clearer picture of on-field performance. See key metrics like Impact %, Havoc %, True Tackle %, Sack % and Pressure %. Plus, uncover key information like run behind data, Chunk %, how often they’re the player being run behind and more.
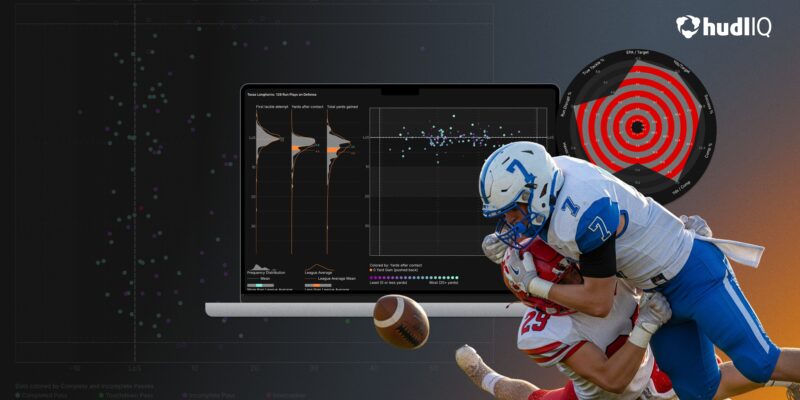
Line Pressures. Use the Line Pressures visualization to see positions and gaps and better understand how players perform when playing different positions or in different gaps. The visualization tool details the number of pressures given up, where they occur and shows how a player’s performance compares to league averages by position.
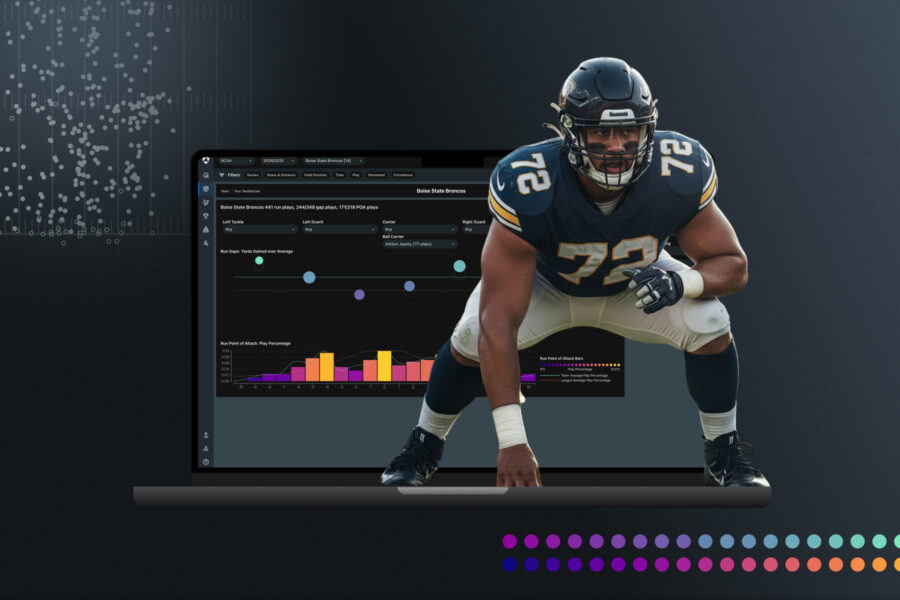
Run Tendencies. Use the Run Tendencies visualization to see rushing yards per average, success rate and percentage of runs in the gap all in one chart. This visualization gives you the ability to look at the inclusion of individual offensive linemen and see how they impact the run game.
Player Comparison. The Hudl IQ Player Comparison tool helps coaches evaluate two or more athletes side-by-side using advanced metrics, visual charts and tagged film. Use familiar player scores or self-select a list of players to compare that are statistically alike. This tool can be used to game plan against similar players or as a transfer portal tool to target statistically comparable players.
Hudl IQ’s radars, protection analysis and line battle insights give coaches a new and massively improved way to evaluate one of the most important positions on the field and build more detailed game plans.
New to Hudl IQ or just need a refresher? Keep learning or book a quick chat with a Hudl expert, and we’ll show you what’s possible.
Browse more articles in Hudl IQ: The EssentialsView the series