Not every save is equally difficult. PSxG measures what standard save percentage misses about goalkeeper performance. Here’s how to read it.
If you've followed this series, you know the pattern by now. Goals tell you who scored — xG tells you who should have. Passes and carries have a surface value and a deeper one. Running distance looks like effort, but the data tells a different story.
Goalkeepers are no different.
Save percentage — the stat everyone uses to evaluate keepers — has the same problem as every other visible metric in soccer. It tells you what happened. It doesn't tell you how hard any of it was.
The Problem with Save Percentage
Every goal a keeper concedes lowers their save percentage. Every routine save improves it.
Save percentage treats a goalkeeper who calmly collects a 30-yard floater as performing at the same level as one who flies to the top corner for a heroic save.
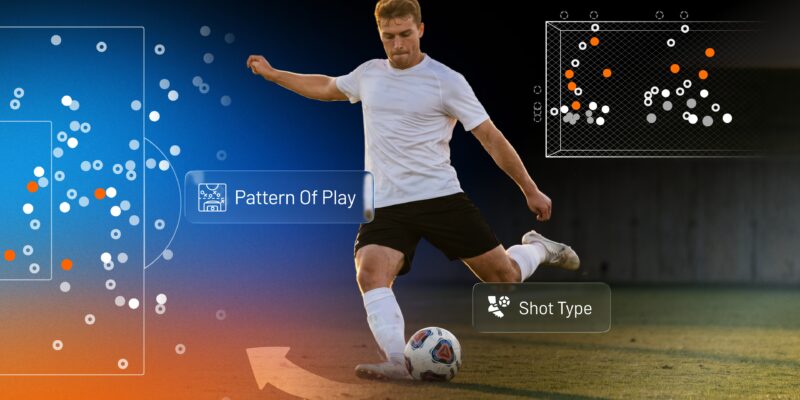
But it gets worse. Standard xG — the shot quality metric we introduced at the start of this series — is effectively useless for goalkeepers as a standalone tool. It's calibrated from the shooter's perspective: the probability a given shot results in a goal before it's struck. That's useful for evaluating attackers. For keepers, it includes every shot regardless of whether it was on target, and keepers only face shots that are actually heading toward goal.
A shot struck perfectly into the top corner and a shot heading straight at the keeper at chest height can have identical xG values. They are not identical saves.
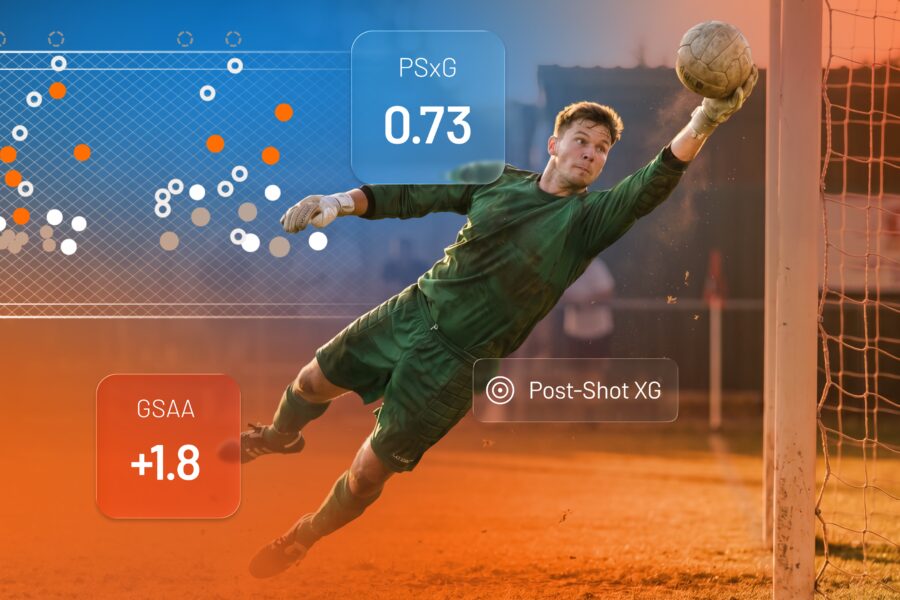
Post-Shot Expected Goals
The Post-Shot Expected Goals (PSxG) metric fixes this by changing the question. Instead of asking "how likely was this shot to go in before it was struck?", it asks "how likely was this shot to go in based on where and how it actually arrived?"
The model uses trajectory, speed, and the location where the ball reaches the goal mouth — all data captured after the shot is struck. A perfectly placed shot bending into the top corner has high PSxG. A tame effort straight at the keeper has low PSxG.
The difference between a keeper's PSxG faced and the goals actually conceded gives you Goals Saved Above Average — GSAA — the most honest measure of individual shot-stopping performance available.
Here's what that looks like in practice. The keeper for AFC Bournemouth in 2017-18, Asmir Begovic's side conceded 58 goals across the season. His PSxG against on-target shots was over 60 — meaning he saved approximately two more goals than an average keeper would be expected to save against those exact same shots. Save percentage would've told you he had a fine season. PSxG told you he was better than fine.
What misleading metrics have in common
There's a pattern worth naming. Total running distance feels like a meaningful performance indicator. More running should mean more effort and better performance. A three-season study of a professional club found the opposite — teams were most likely to win when players had high fitness and actually ran less than average. High readiness, efficient movement, better decisions. The visible metric was pointing in the wrong direction the whole time.
Save percentage does the same thing to goalkeepers. It rewards volume and punishes difficulty. A keeper who faces ten brutal shots and saves eight looks worse than one who faces ten routine ones and saves nine. PSxG corrects for that by asking the right question: not how many saves were made, but how hard were the saves that were made?
What to watch for
The next time a keeper makes a save, ask yourself: where did that ball end up, and how quickly did it get there?
A save in the bottom corner from a cutback across the six-yard box isn't a spectacular save. It's a keeper doing their job in a manageable situation. A keeper who tips a driven shot around the post at full stretch, or who reacts to a deflection in under half a second, is doing something genuinely difficult that save percentage won't distinguish from the routine stop.
Pay attention to keepers who concede goals that looked unstoppable. A goalkeeper beaten by a deflected shot from 25 yards that clips the inside of the post has "conceded a goal" by the traditional measure. PSxG disagrees — and so should you.
The complete picture
Four articles in, you've got a framework that covers the entire pitch.
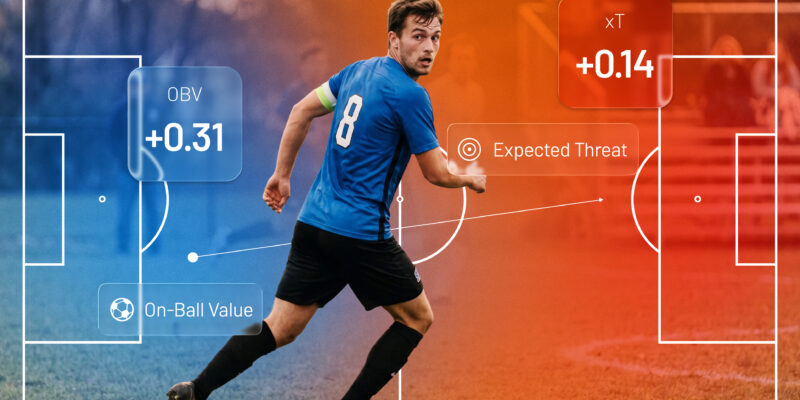
xG tells you whether a scoreline was deserved. PPDA tells you how aggressively a team is hunting the ball. xT and OBV tell you how every action moves the game, not just shots. And PSxG tells you whether the goalkeeper is making their team better or just collecting easy ones.
None of these metrics tells the whole story on its own. Together, they get you much closer to understanding what you're watching than any box score ever will.