How to Watch Soccer: How Expected Threat (xT) Measures Midfielders
xG tells you about scoring chances. But what about the midfielder who ran the game without hitting the back of the net? Here’s how analysts measure every action that matters.
What xG leaves out
If you read the first piece in this series, you know that expected goals (xG) measures the quality of scoring chances. The model is excellent at telling you whether a team created a true scoring chance and whether a scoreline was justified based on the chances created.
What it doesn't do is value the pass that created the chance, the carry that beat three defenders before the pass was even possible, or the pressing action that won the ball back thirty yards from goal and set everything in motion.
For strikers, xG is a helpful data point. For midfielders, it misses most of the job description. For defenders, it's nearly useless.
So, analysts created a different model to measure the genius of the maestros who contribute in less immediately obvious ways.
Expected Threat: Valuing Every Zone of the Pitch
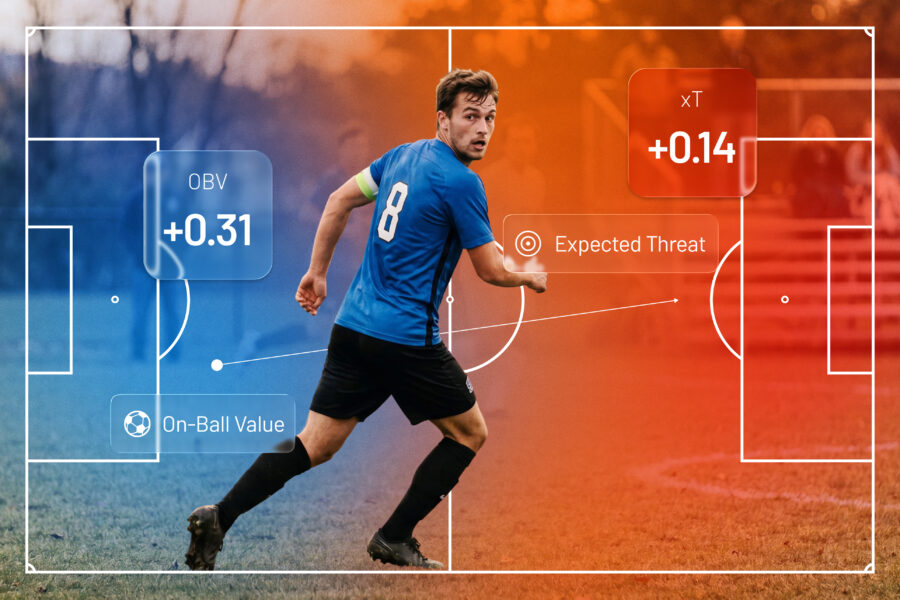
Expected Threat (xT) works from a simple premise: every position on the pitch carries a probability of leading to a goal. A ball in the attacking penalty area is extremely threatening. A ball in your own defensive third, not so much.
Analysts divide the pitch into zones and assign each one a value based on historical data — how often does possession in this zone lead to a goal? Every pass or carry that moves the ball from a lower-value zone to a higher-value one is credited with the difference. You didn't score. But you moved the ball somewhere more dangerous. That's worth something.
The midfielder who plays four line-breaking passes that open up space in behind? His xT is accumulating with each pass. The winger who carries from the flank into the penalty area? Every meter of that carry adds to his total. Goals are almost always the result of a long sequence of actions that incrementally increase the threat level.
xT measures the whole chain.
What it Looks Like: Declan Rice
Declan Rice at Arsenal in 2024-25 is one of the clearest illustrations of xT thinking in action.
Rice didn't finish 2024-25 with dramatically different goal or assist numbers. What changed was how Arsenal built around him. The arrival of Martin Zubimendi shifted Rice's role — instead of being both the defensive anchor and the progressive option, he became almost purely the engine of forward ball movement. The results showed up in the data.
His deep progressions went from 6.07 to 8.37 per 90. His completed line-breaking passes — passes that bypass an entire defensive line — increased by 39%. His share of ball receipts in the central corridor of his own half jumped from 24% to 39%, with nearly a full metre more space around him on average than the season before.
None of that shows up in a traditional box score, but it all shows up in xT.
OBV: The Model that Values it All, Including Defense
xT handles passes and carries well. But every data point has its shortcomings: Because xT is based on zones, a player could move a small distance — from the edge of one zone into the edge of another — and gain more xT value than the action was truly worth.
To solve for this, analysts incorporate a different model.
On-Ball Value (OBV) is a stat developed by Hudl that assigns a positive or negative number to every single action a player takes on the pitch, based on how much it shifts the probability of their team scoring or conceding.
This model not only values actions that happen off the ball — defensive pressure, interceptions, blocks, runs that pull a defender — but understands the distances of movements with more nuance.
A completed line-breaking pass adds value. A turnover in a dangerous area subtracts it. A recovery tackle that prevents a counter-attack adds it back. Every action has a cost and a return, and over the course of a match — or a season — the balance tells you whether a player is making their team better.
This is why OBV is particularly useful for evaluating pressing teams. A forced turnover in the attacking half is one of the highest-value actions in the sport. OBV captures it. PPDA tells you how often a team achieves it. Together, they paint a picture of defensive value that xG alone never could.
The Last Position to Cover
xG values strikers. xT and OBV value midfielders, defenders, and the full sequence of play leading to a chance. The one position neither model fully captures on its own is the goalkeeper — and that's where the fourth piece in this series culminates.
If you want to catch up on how we got here, start with xG or read about pressing metrics.
Hudl works with the world's largest library of soccer video and data, from youth development through the professional game. This series breaks down how the sport is actually understood at the highest level.
See how Hudl helps clubs develop players and win more games.