Defensive Responsibility: A New Way To Measure Defensive Output
4 Jun 2026
8 min Read
Defending is one of the most complex and least understood aspects of football analytics. We can measure what a team concedes - expected goals against, possession value conceded - but attributing that to individual players has always been far harder.
For years, trying to quantify individual defensive contributions from event data has been an uphill battle. The earliest approaches simply counted raw defensive actions, such as tackles, interceptions, and blocks. But it quickly became clear that raw counts don’t measure defensive quality; they only measure defensive volume. A centre back in a low-block team racked up the blocks and clearances, while world-class defenders looked entirely anonymous on a spreadsheet.
Possession-adjusted metrics were the next step forward, normalising defensive actions against the opposition's time in possession. We could account for the fact that a player on a low-possession team faces more defensive situations than one on a team that dominates the ball. Now we’re cooking, or so we thought. It was a meaningful improvement, but it introduced a different problem in that it treats every moment of opposition possession as an equal defensive opportunity, regardless of where the ball is, what kind of action is being played, or which player on the defending team would actually be expected to respond to it. A lateral pass between two centre backs in the opposition half counts the same as a through ball into the penalty box.
To truly understand defensive impact, we have to stop treating defending as a collection of isolated events, and start treating it as a dynamic system. We need a framework that understands not just what happened, but who was actually supposed to deal with it.
Enter Defensive Responsibility (DefR).
Defensive Responsibility (DefR) is an event-based framework that distributes defensive accountability across a team. It looks at every carry, pass, and shot the opposition makes and predicts - based on the location of the action, the momentum of the attack, and the defensive shape of the team - which player in which role would typically be expected to respond to it.
The result is a Responsibility Matrix. For every player, across every match, we know how many defensive actions were expected of them and how many they actually made. The difference - defensive actions above or below expectation - is the first signal: a measure of defensive proactivity.
But proactivity alone doesn't tell the whole story. A player can engage frequently and still allow the opposition to progress the ball through their zone. That's where our second metric comes in. By layering On-Ball Value - our possession value model that evaluates each action based on the +/- impact it has on a team’s chances of scoring and conceding - onto the Responsibility Matrix, we can distribute the attacking value generated by the opposition proportionally across the defending players - weighted by their responsibility for each event. The result is Responsibility-Weighted OBV Conceded: a measure of how much attacking value a player allows through their defensive domain.
Together, the two metrics offer a more complete picture of defensive output than has previously been possible from event data alone.
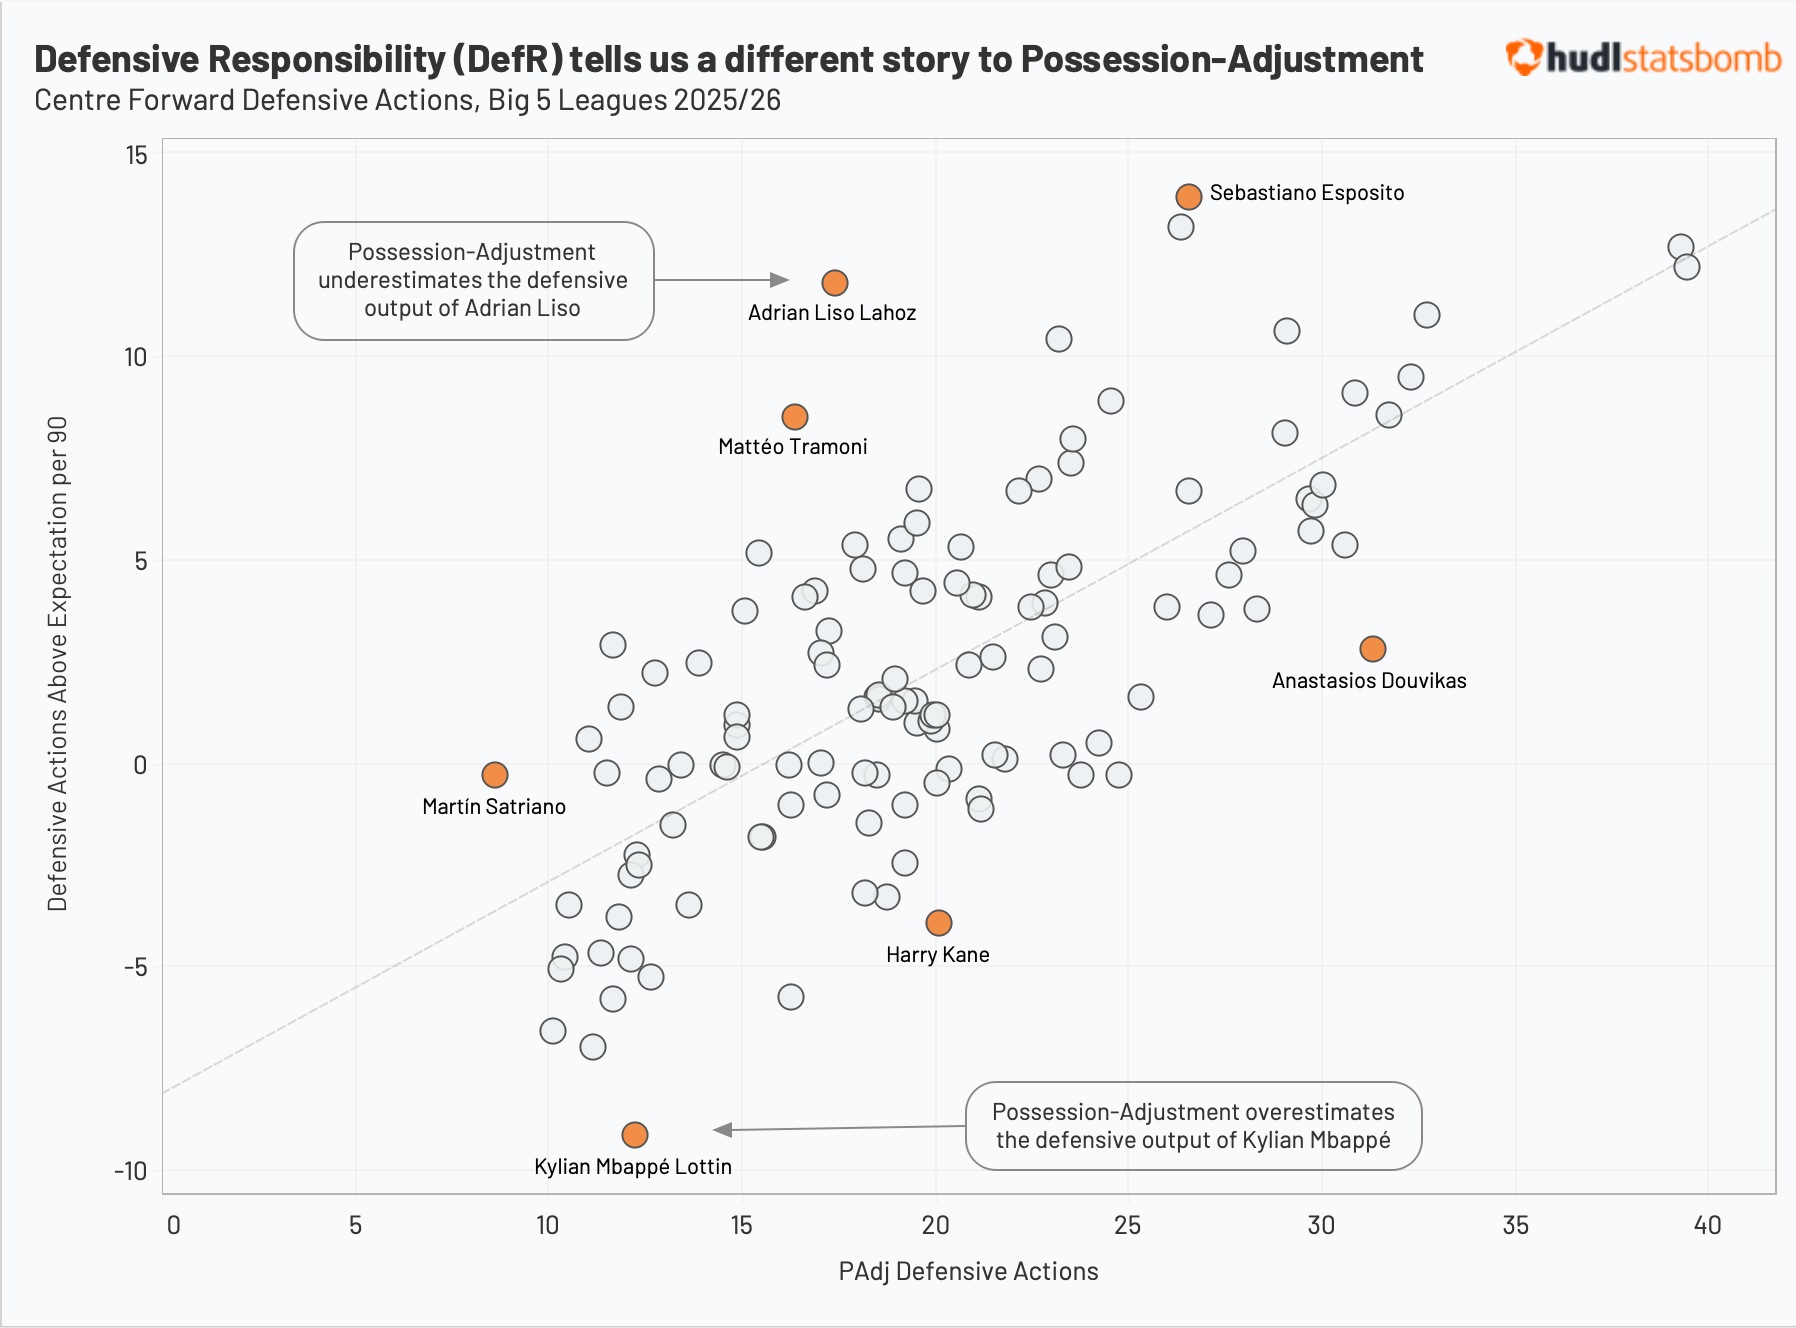
So what does DefR actually tell us that we didn't know before? The clearest way to answer that is to put it side by side with possession-adjusted defensive actions and see where the two metrics disagree.
The two metrics do correlate, but the divergences are where it gets interesting.
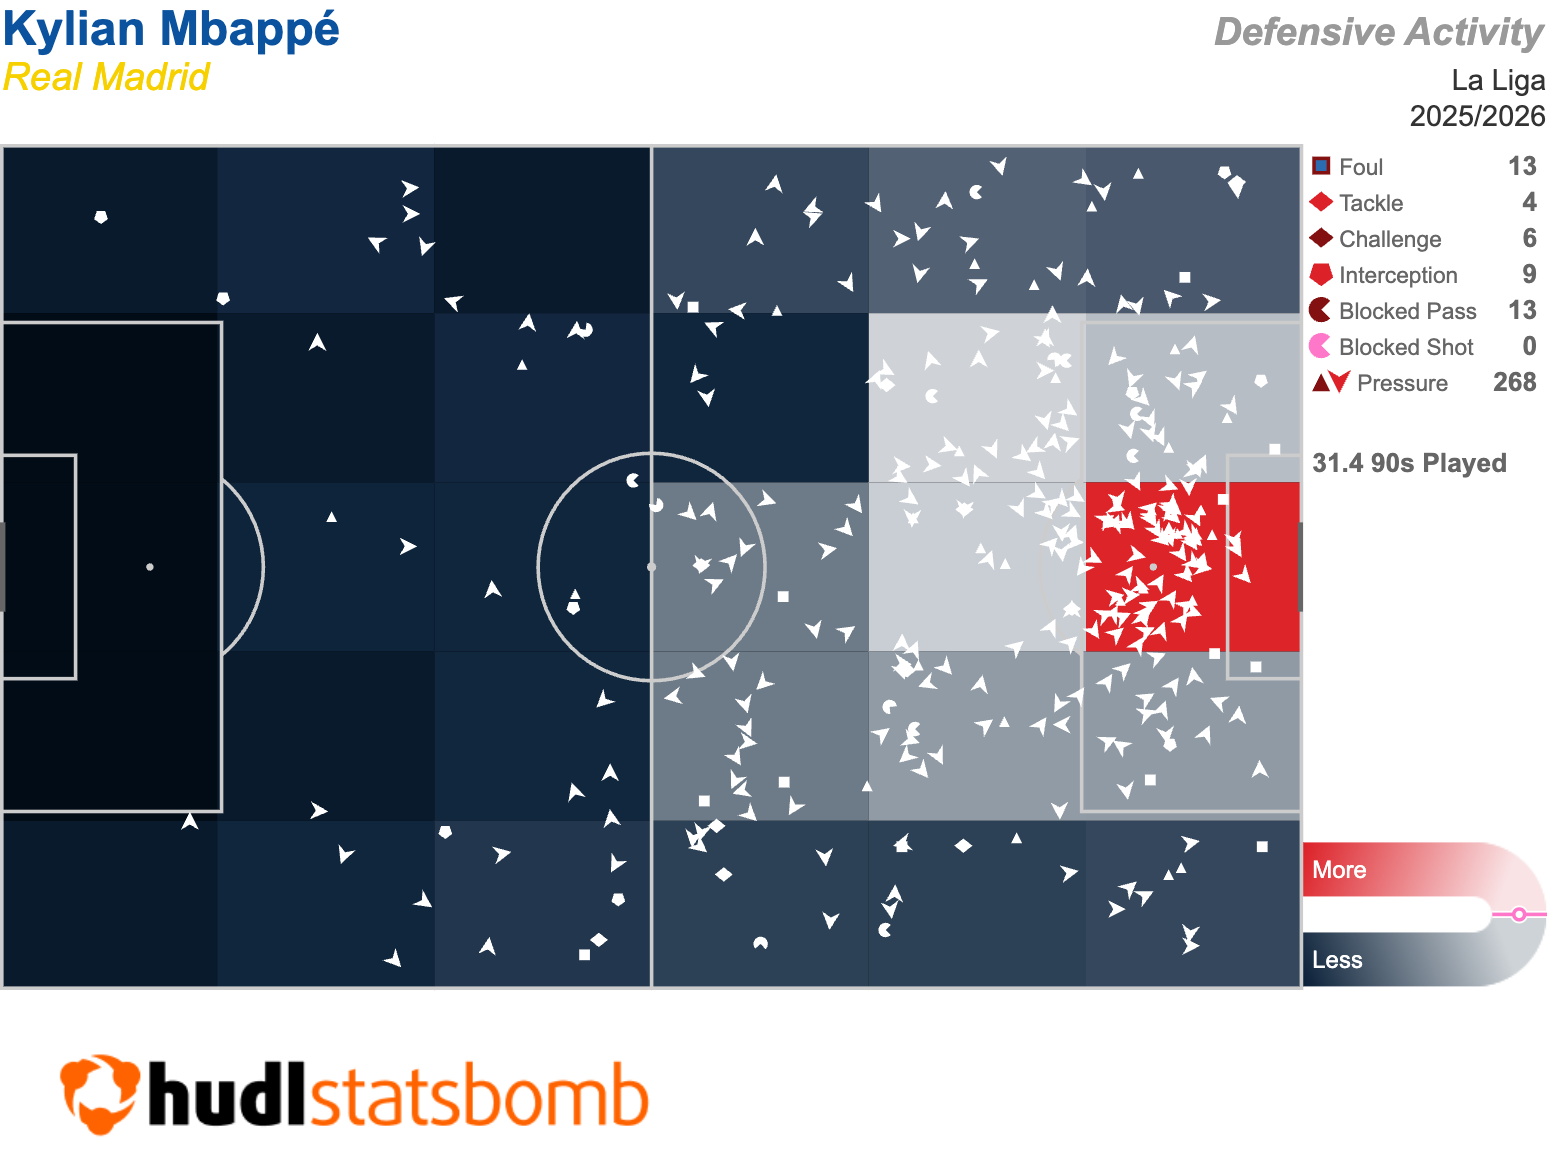
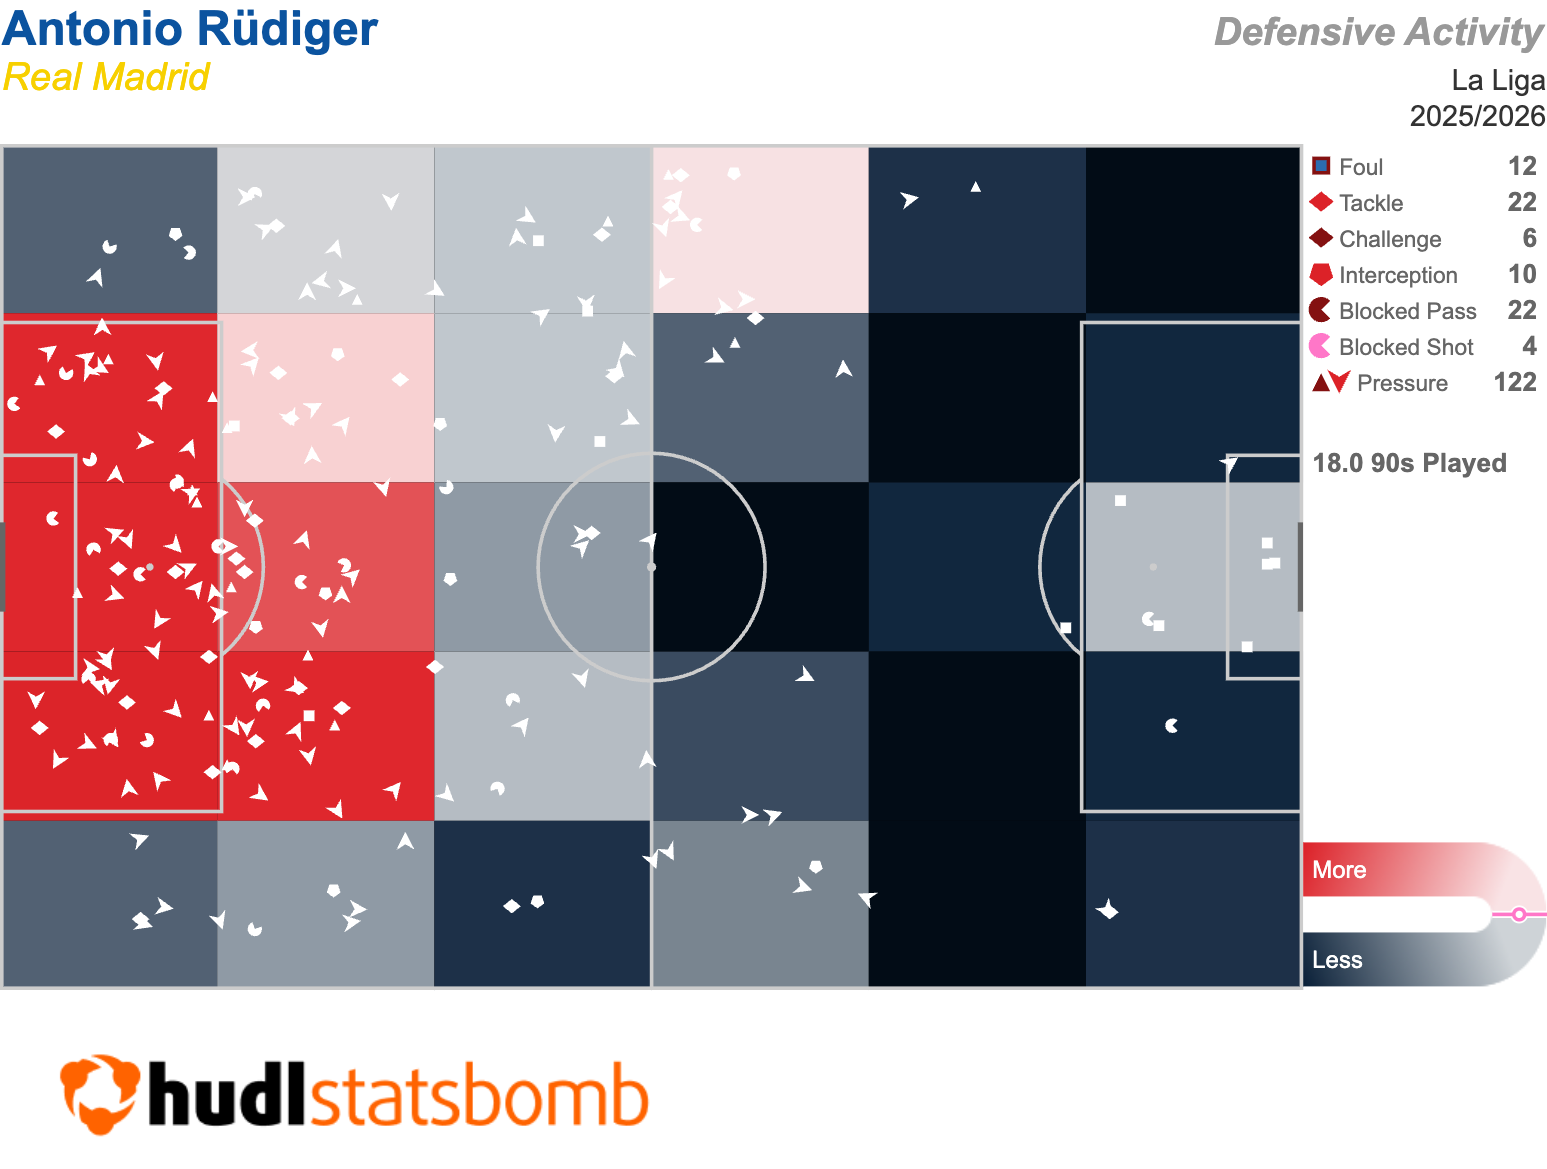
Take Kylian Mbappé. Real Madrid's 59% average possession lifts the possession-adjusted numbers of their entire squad. PAdj sees Mbappé as a modestly infrequent defensive contributor. DefR is more sceptical, identifying Mbappé as the clear outlier when it comes to defensive output when accounting for the actual attacking actions played through his zone and his defensive output against them. His defensive activity map further highlights this.
On the other hand, by possession-adjusted metrics Adrián Liso of Getafe looks like a middle-of-the-pack defensive contributor. But Getafe average just 41% possession, meaning PAdj has been quietly depressing the defensive numbers of Liso and his teammates, while underselling what Liso himself is actually doing relative to what was asked of him. DefR corrects for that.
This is the core upgrade DefR offers over PAdj: it stops penalising players for their team's lack of the ball, and stops rewarding players for their team's dominance of it.
Knowing how proactive a defender is is only half of the picture, though. The question that follows is inevitable: how much of an opposition’s attacking threat is a defender responsible for conceding?
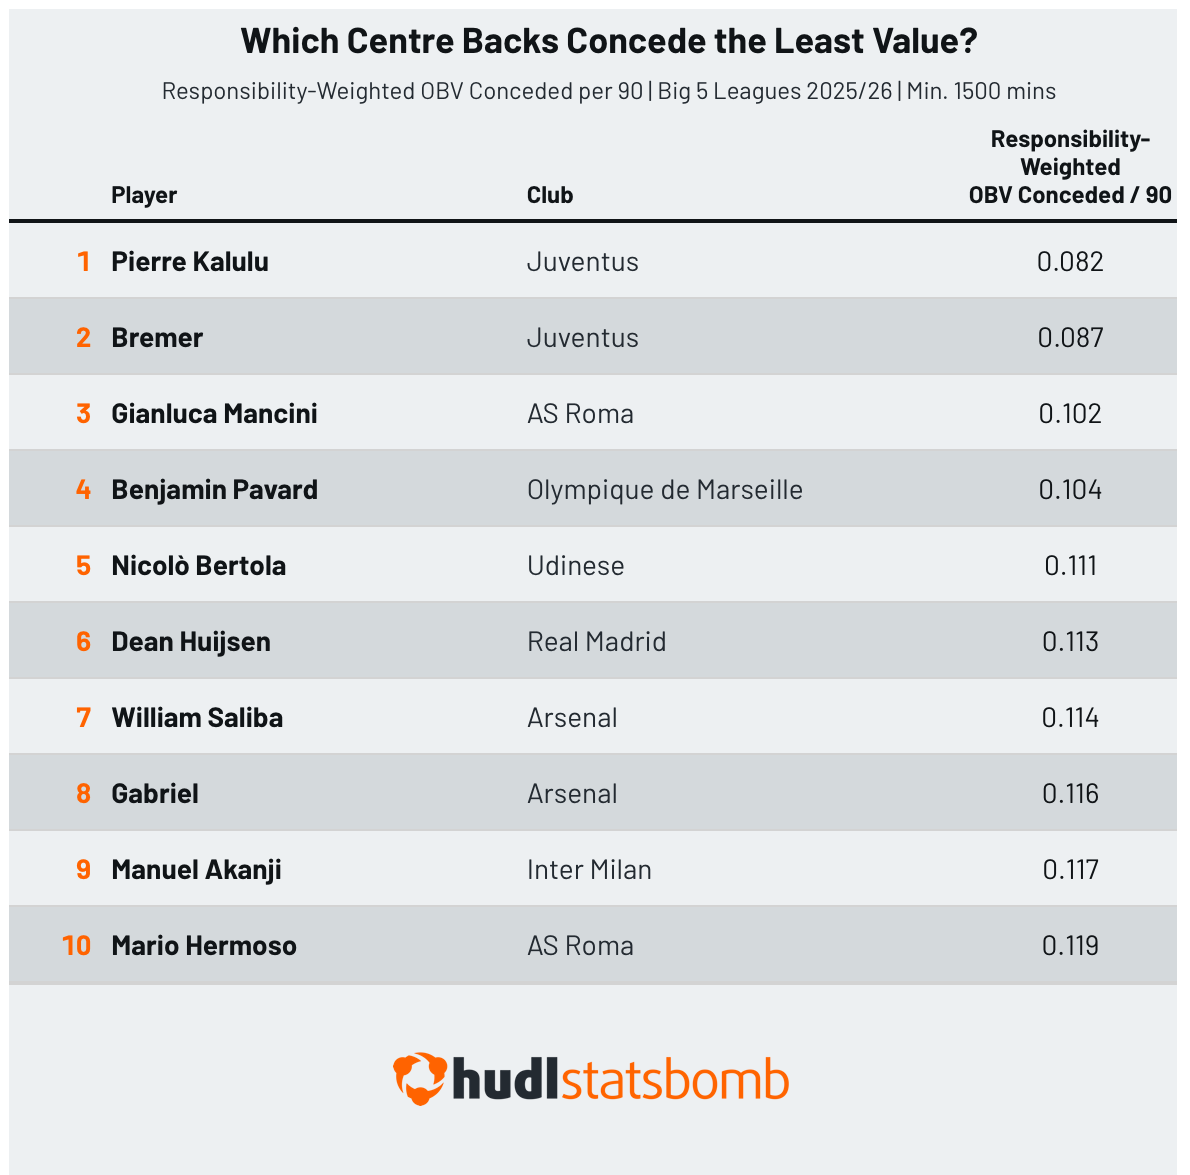
That's what Responsibility-Weighted OBV Conceded (DefR OBV) is designed to answer. Every time an opponent successfully executes an action, the value they generate is distributed across the defending players proportionally to their estimated responsibility for that event. A centre back who consistently allows high-value progression through their defensive territory will accumulate a higher DefR OBV.
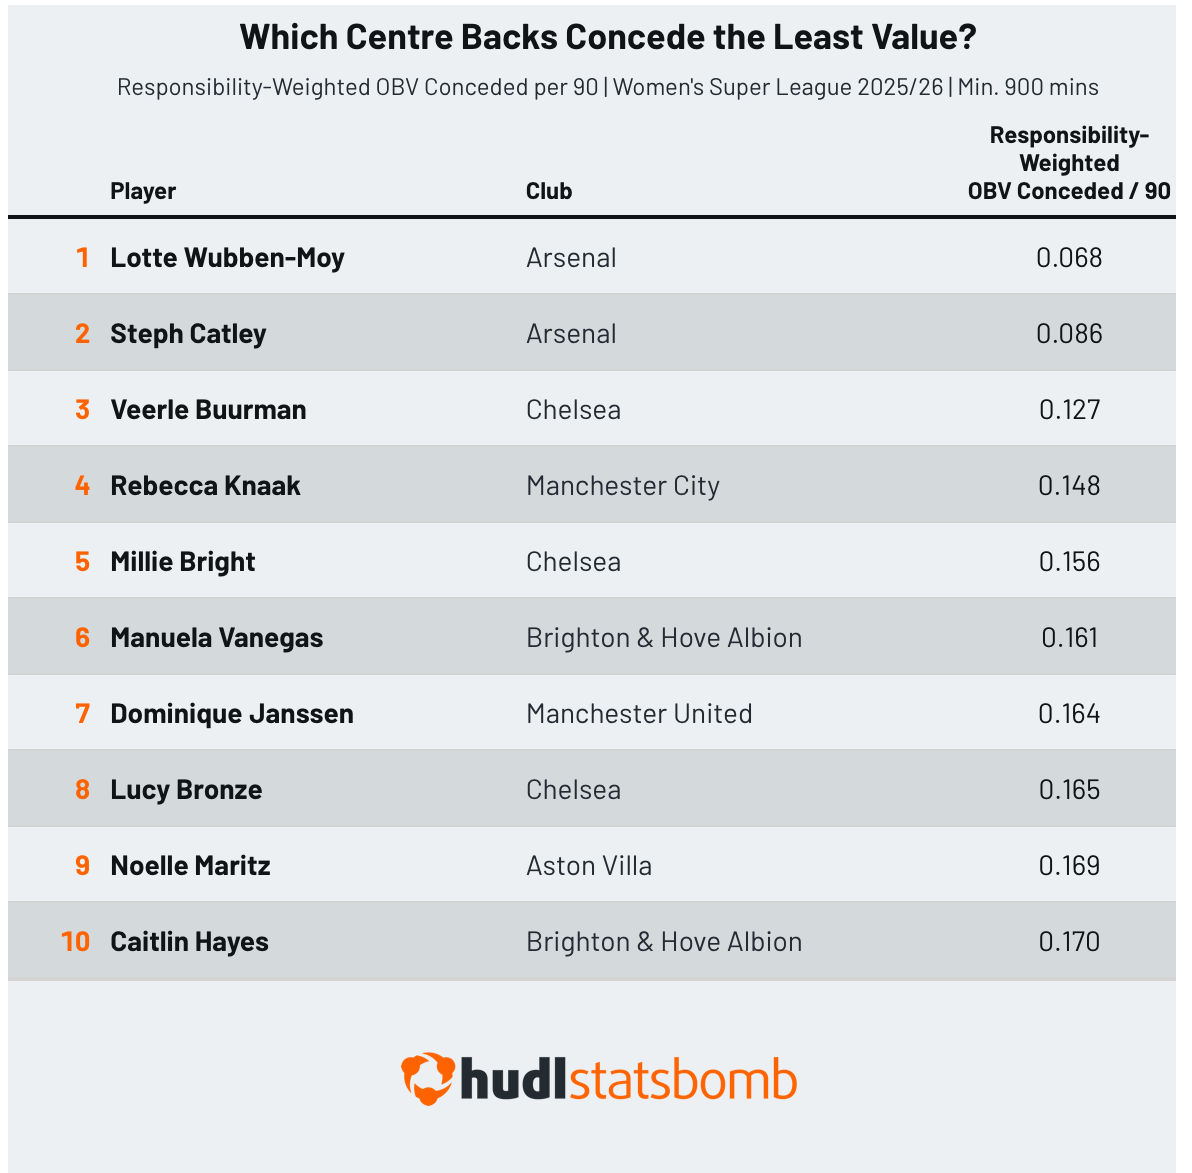
The table below shows the top 10 centre backs across the Big 5 leagues in 2025/26 by DefR OBV Conceded per 90 minutes.
Applying Defensive Responsibility (DefR)
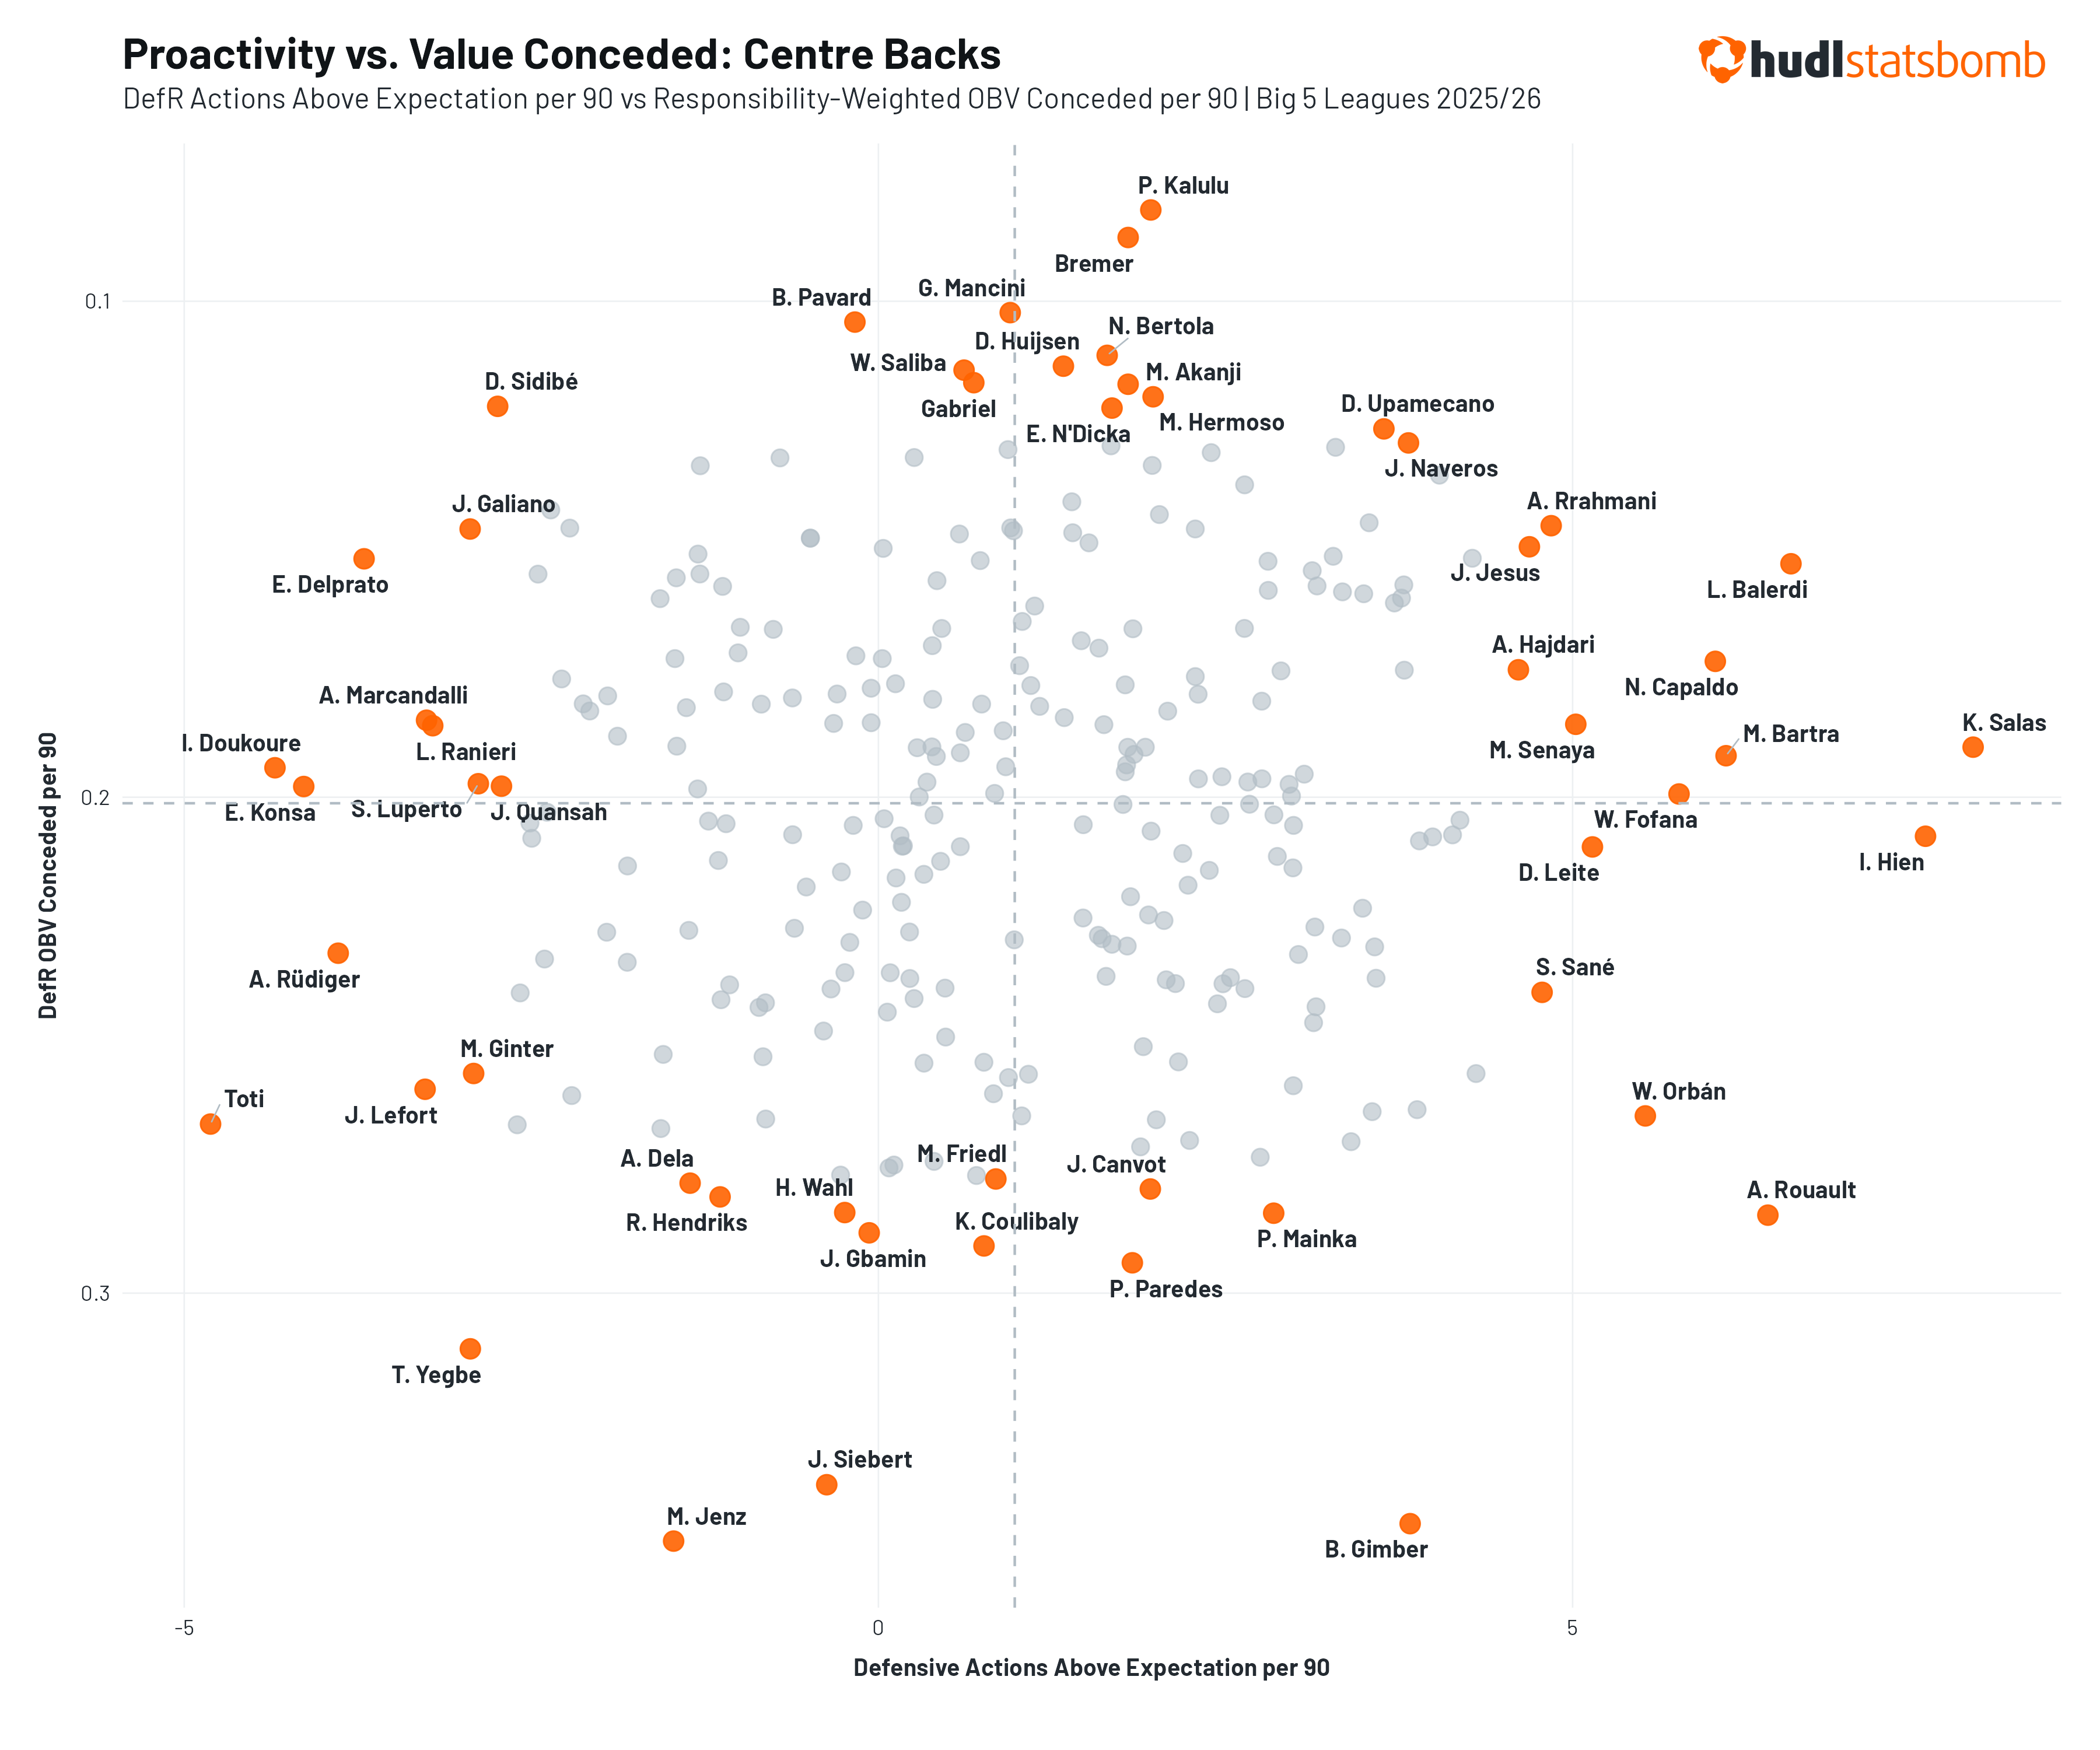
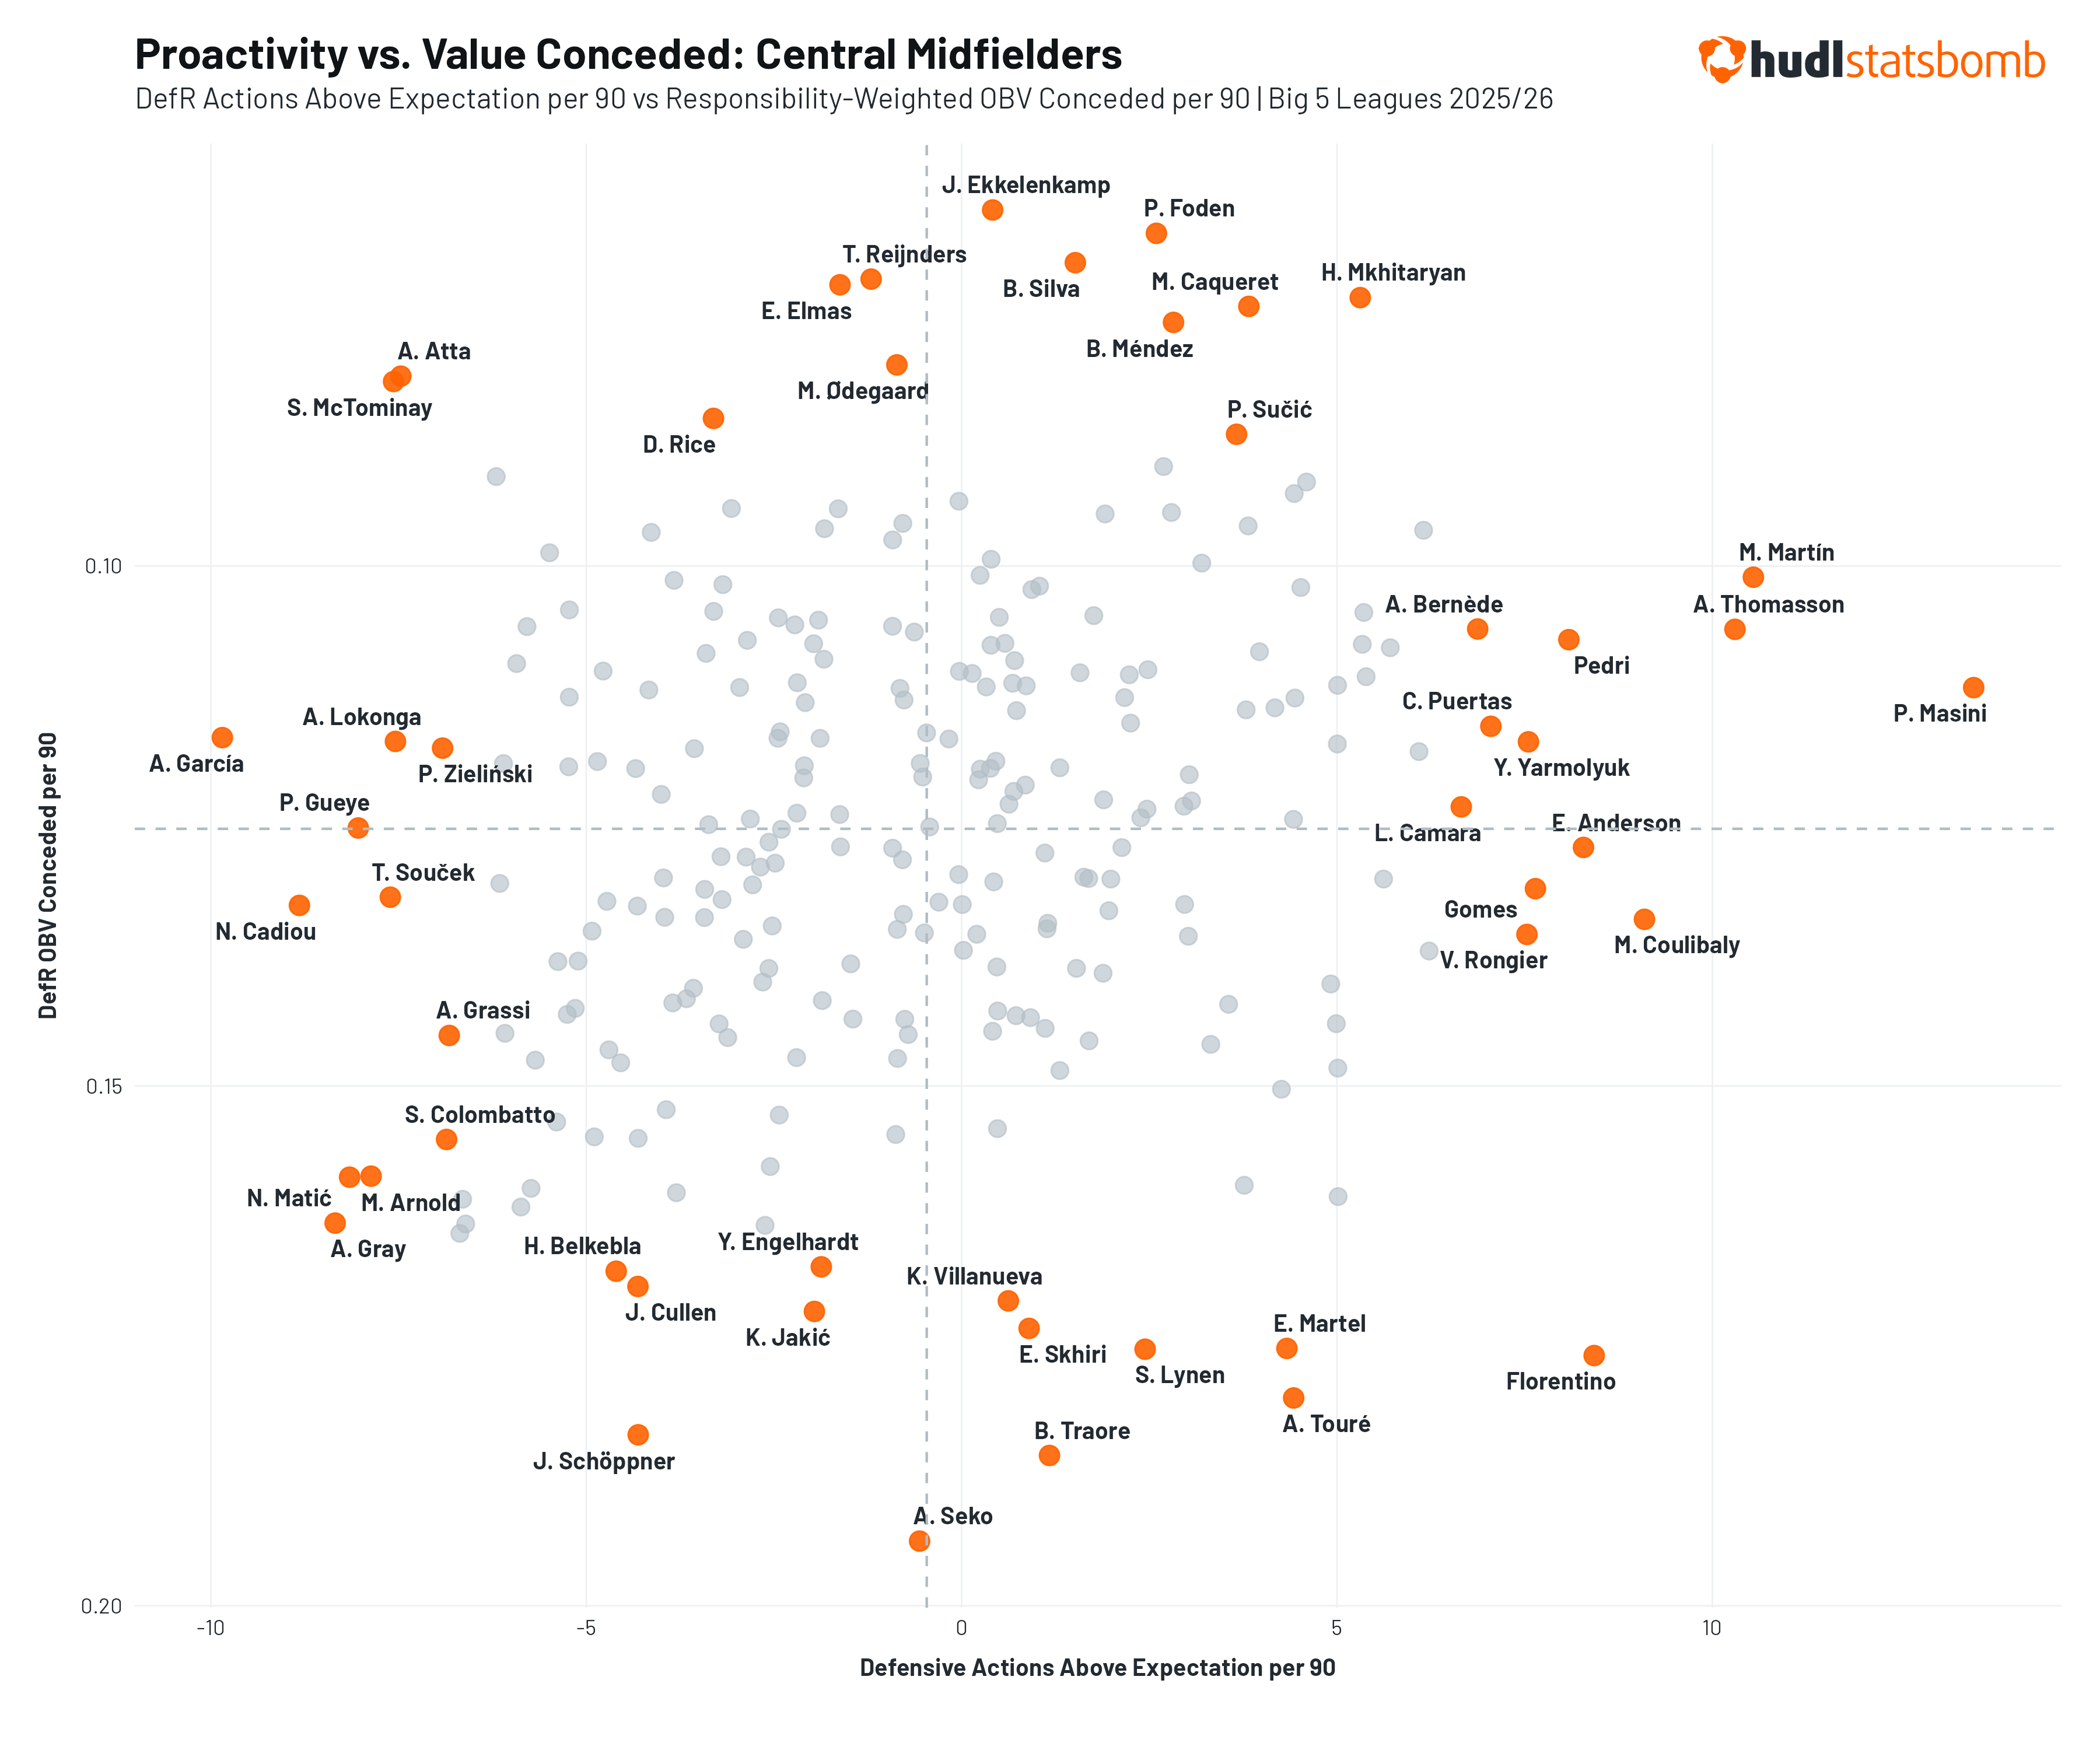
Evaluating centre-backs is notoriously difficult because their data is highly dependent on their team's defensive approach and the opponent's attacking approach. With both metrics now available, we can combine them to build a more complete picture of a centre-back's defensive profile. Plotting Defensive Actions Above Expectation against Responsibility-Weighted OBV Conceded divides centre-backs into four distinct archetypes.
Proactive and Suppressive
Top Right Quadrant
Bayern Munich’s Dayot Upamecano is a good example here: above average for both proactivity and opposition value suppression. A front-footed defender who is happy to step onto the opposition attacks and shut them down at source, ensuring that very little progression is allowed to occur through his defensive zone.
Proactive but Permissive
Bottom Right Quadrant
Rennes’ Anthony Rouault is even busier than Upamecano. In 2025/26 he recorded significantly more defensive actions than his positional responsibility demanded (6.4 Defensive Actions Above Expectation per 90 minutes), engaging the opponent at every opportunity. But the DefR OBV data suggests that he’s leaving gaps in the Rennes defence that his opposition are able to exploit.
Passive and Permissive
Bottom Left Quadrant
Antonio Rüdiger sits 3.9 defensive actions below expectation per 90, one of the most passive profiles in the dataset and an indication that Rüdiger preferred to hold his line rather than engage the opponent in 2025/26. There’s nothing wrong with that in principle – that can be an effective approach, as we'll see below. In Rüdiger's case, however, DefR OBV suggests it didn’t really work. Opponents were able to progress through areas where the average centre back would be expected to intervene and stop the attack. His defensive activity map reinforces this reading, with his defensive activity concentrated around the Real Madrid penalty area. Perhaps too much so.
Passive but Suppressive
Top Left Quadrant
Arguably the most interesting archetype. Enrico Delprato, club captain at Parma in Serie A, records a similarly passive profile to Rüdiger, with 3.7 defensive actions below expectation per 90 in 2025/26. But where Rüdiger's passivity allowed Real Madrid’s opponents into valuable areas, Delprato's was able to suppress the opposition from creating down his side. He conceded just 0.15 OBV per 90 through his responsibility zones - well above average for his position - suggesting a defender who reads the game well enough that he rarely needs to engage, and when opponents do play through his zone, they find little reward.
Central Midfielders, though having different demands placed upon them, can be evaluated similarly.
Comparing the output of Elliott Anderson and Pedri demonstrates the utility of DefR.
In raw numbers, Anderson’s role in a low-possession Forest side saw him engage in slightly more tackles, interceptions, and pressures per 90 minutes than Pedri. When you apply the traditional possession-adjustment to those numbers, the data swings wildly the other way: Pedri’s output skyrockets to 35 PAdj Pressures per 90 - an alarming 70% higher than Anderson’s 22 PAdj Pressures per 90.
But DefR reveals that both metrics miss the true story. By measuring their output against the exact spatial and tactical opportunities they faced, DefR reveals that Anderson and Pedri are actually performing at a similarly elite level - registering roughly 8.2 defensive actions above expectation. Anderson is an ultra-active destroyer tasked with a high defensive workload; Pedri plays in an intensely aggressive Hansi Flick system where he actively hunts down the ball the second possession is lost. Traditional metrics forced a gulf between them; DefR recognises that their individual defensive hunger is exactly the same. And their proactivity isn't just noise. When Anderson and Pedri engage, they tend to prevent the opposition from generating value through their midfield zones. Their aggression is purposeful, and the outcomes back it up.
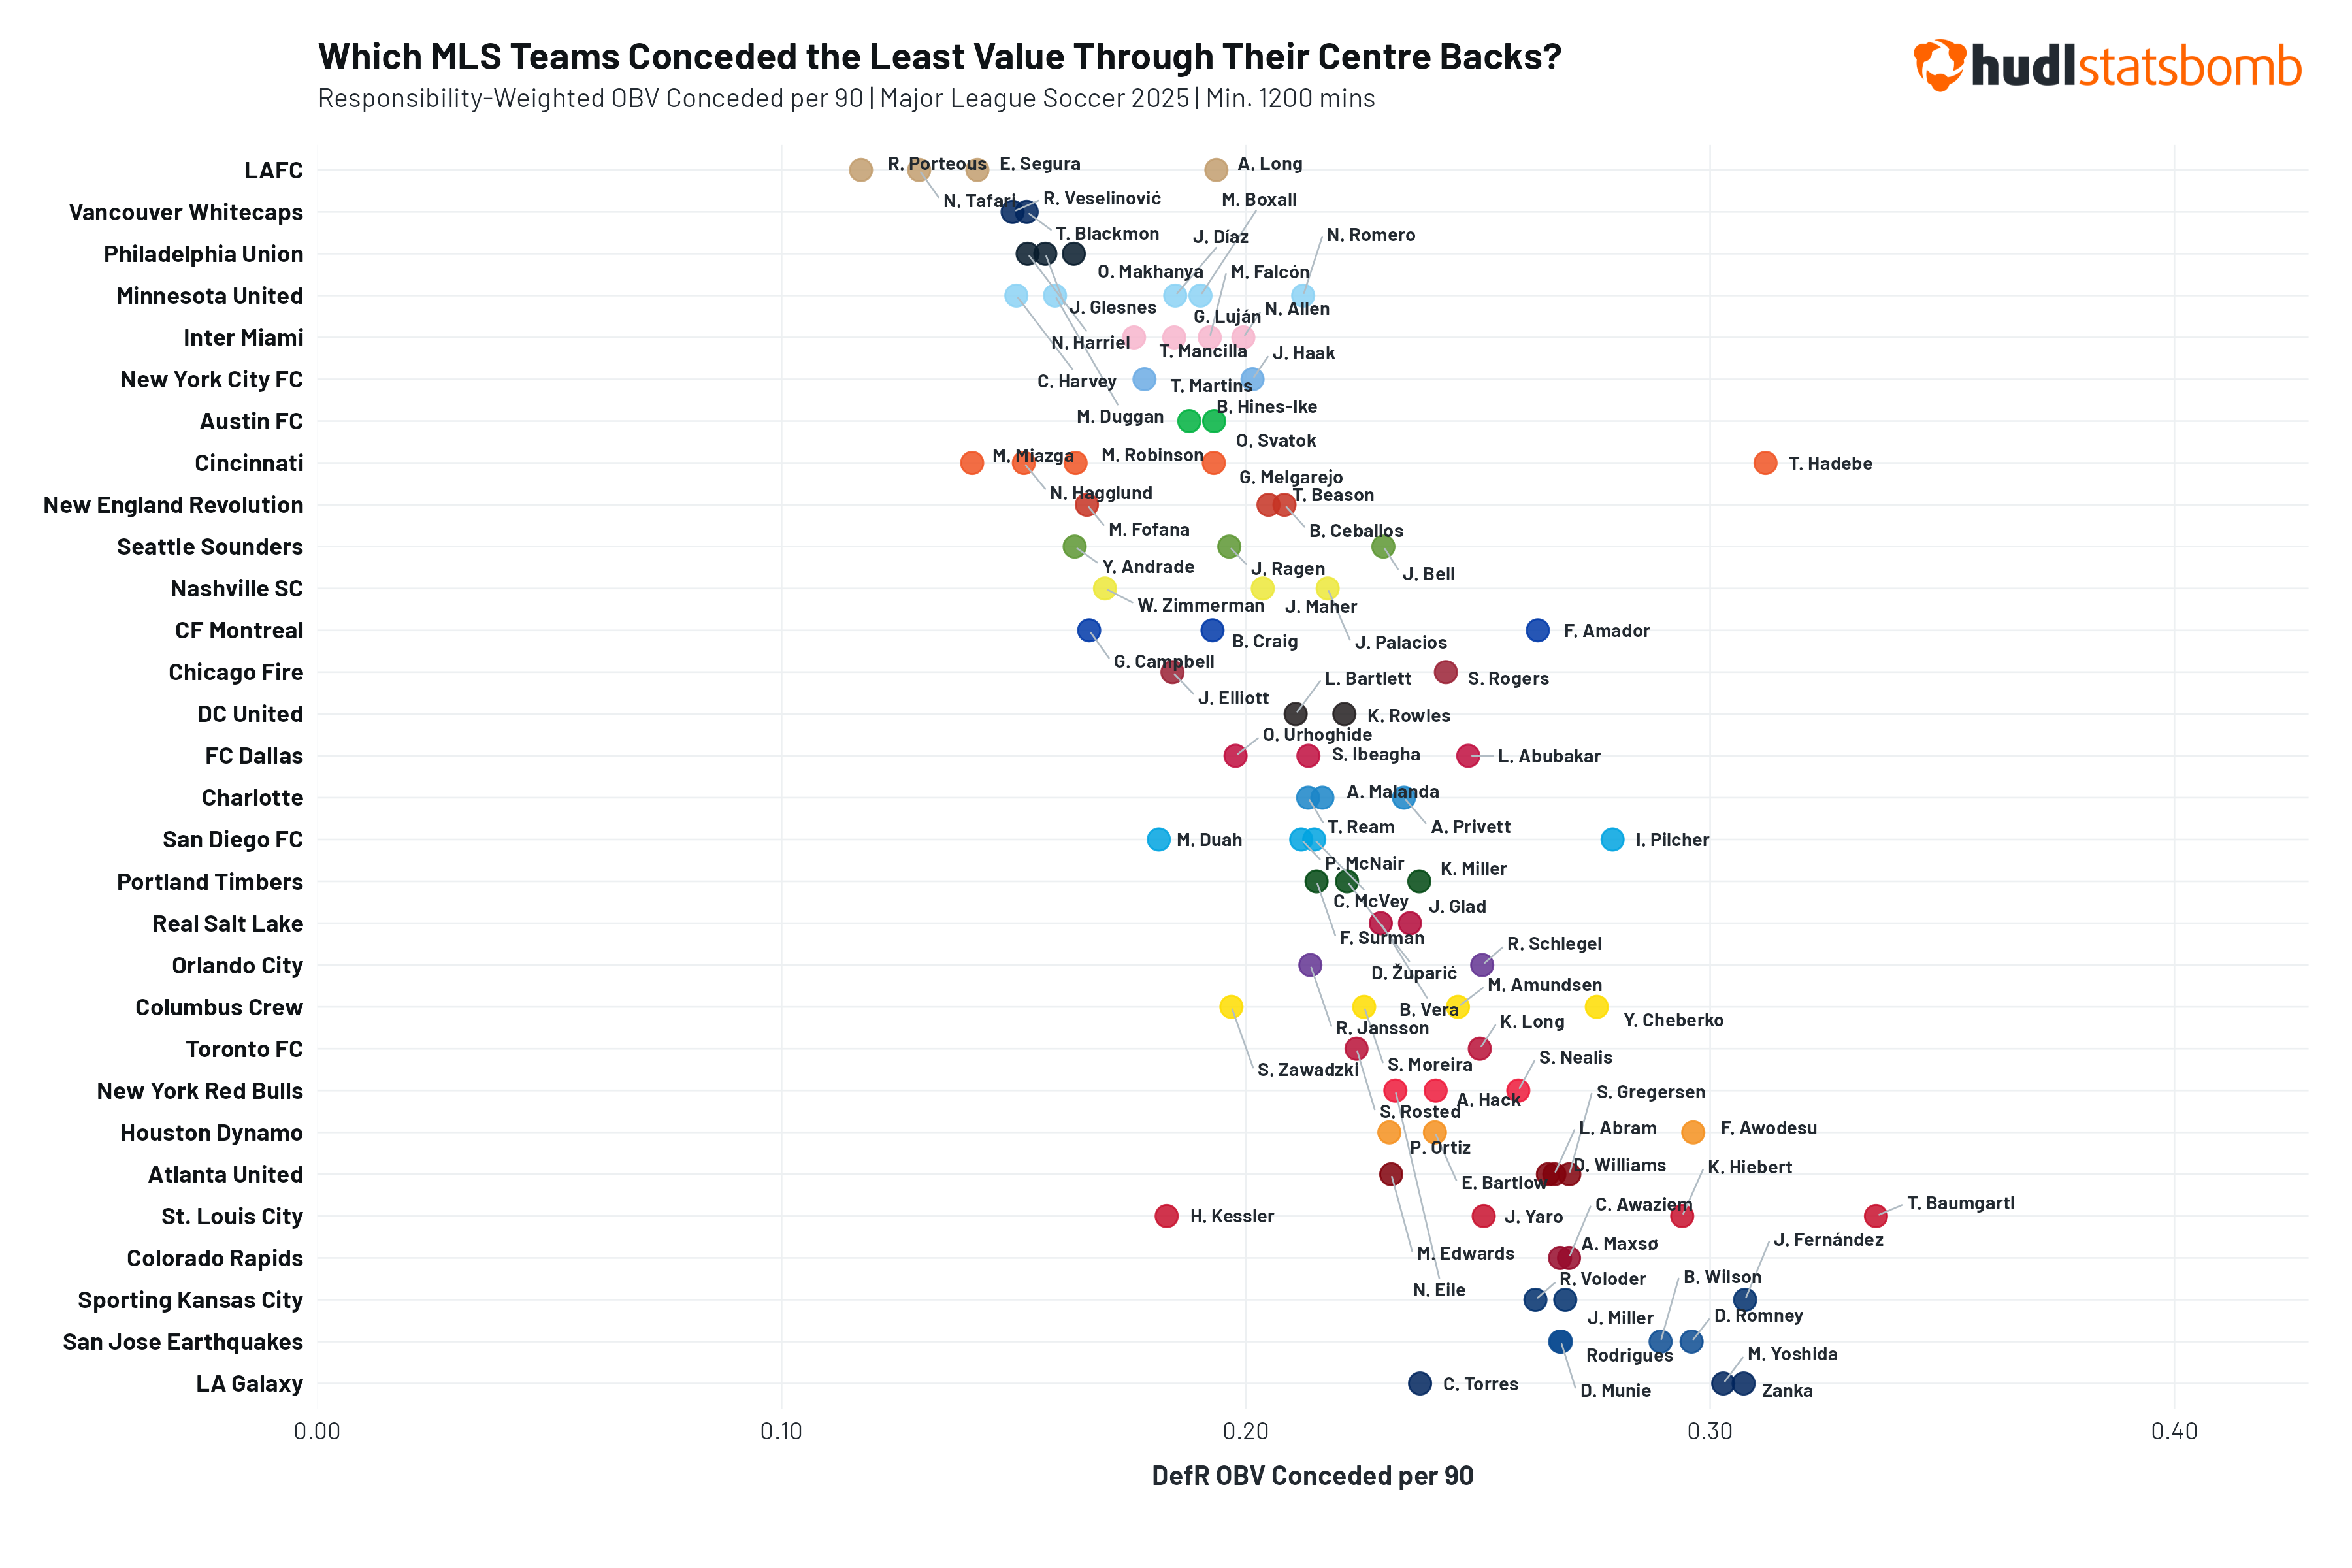
DefR isn’t a tool reserved exclusively for the elite. It is fully integrated across Hudl Statsbomb's global database, allowing analysts to scale their recruitment across continents…
…and in both the men's and women's games.
With DefR, recruitment analysts and clubs can finally cut through the noise of possession dominant and low-block biases to identify genuine out-of-possession workload. By moving away from flat normalisations and treating the defending team as a dynamic network of positional roles, DefR allows us to evaluate players based on what their specific tactical system and the opposition's attack actually demanded of them - and how well they responded to those demands.