AI Volleyball Stats Explained: What Coaches Need to Know
Jul 28, 2025
10 min Read
Understand the key AI volleyball stats — like rally efficiency and rotation impact — and how they help coaches make smarter decisions.
Data-driven coaching has moved from luxury to necessity in today's competitive volleyball landscape. AI-powered statistics are revolutionizing how coaches analyze games, develop players and create winning strategies. In this AI era, you can’t afford not to know about the opportunities and options.
These are key concepts every coach should understand and apply when analyzing performance.
Note: These statistics can be interpreted as individual or team stats.
Basic Skills & Statistics
Attack
Kill: An attack that is not returnable by the opposing team and leads directly to a point for the attacking team.
Error: Charged to a player whenever an attack or attacker: hits the ball out of bounds; hits the ball into the net, resulting in a four-hit violation; or is blocked down by the opposition to the same side as the attacker, and cannot be kept in play as a direct result of the block. This directly results in the defending team winning the point.
Total attempts: When a player attempts to attack the ball into the opponent's court. The ball may be set, tipped or hit as an overhead contact. There are three possible outcomes of an attack attempt: kill, error or attempt (an attack not resulting in a kill or an error).
Attack percentage: The equation used is (kills - errors)/total attempts. For example, 5 kills minus 3 errors, divided by 10 total attempts equals .200 attack percentage.
Serve
Service ace: When a player serves the ball and the opposing team is unable to pass it. An ace occurs when the ball either hits the ground or is shanked off of a passer, making a second touch impossible.
Service error: Charged to a player if: the serve hits or fails to go over the net; the serve goes out-of-bounds; the server is called for a foot or time violation; or the server serves out of rotation.
Total attempts: A service attempt is given any time a player attempts to serve the ball, including when a player is given a service ace or service error.
Serving percentage: The equation used is (service aces – service errors) / total attempts. For example, 4 aces minus two errors divided by 15 total attempts equals .133 serving percentage.
Serve Receive
Pass quality rating (0-3):
3 point pass: A "perfect" pass or a pass where a setter can comfortably set all three attackers.
2 point pass: A "medium" pass or a pass where a setter can comfortably set two attackers. Typically a 2-rated pass would not be easy to set your middle attacker.
1 point pass: A "poor" pass. Typically a setter only has one option on who to set and possibly no options. This is a pass that does not immediately result in an error, but the setter is not able to choose who to set.
0 point pass: A “zero” pass results in an ace for the other team.
Total attempts: Culmination of all pass attempts.
Passer percentage: Sum of all the pass quality ratings divided by the total attempts.
Set
Assist: Any contact, typically a set, where the next immediate contact results in a kill.
Total attempts: Anytime a set, pass or dig to a player results in that teammate attacking the ball.
Dig
Dig: Awarded when a player successfully plays a ball that has been determined to be an attack attempt by the opponent.
Cover: A cover is also counted as a dig. A cover is the result of playing the ball up immediately after a block occurs.
Block
Block: Awarded when a player (or players) at the net deflect(s) an opponent’s attack and the ball lands on the attacking team’s side for a point or an immediate sideout, without any other player making a play on the ball.
Block assist: Any successful block resulting in an immediate point where there’s more than one front row player with their hands above the net at the point of the attacker's contact with the ball.
Block solo: Any successful block resulting in an immediate point where there’s only one front row player with their hands above the net at the point of the attacker's contact.
Block error: Number of blocks where the player was called for fault, such as touching the net or crossing the center line.
Blocks per set: The average number of successful blocks a player or team records per set. It’s calculated by dividing the total number of blocks by the total number of sets played.
Serve and Reception Effectiveness
Serving and passing are the foundation of successful volleyball, and the ability to interpret these stats with clarity can make a major impact on how coaches train, adjust and win.
Serving
Point scoring: Refers to the total number of points a team earns while they’re serving, including aces and any plays that result in winning the rally during their service.
Ace percentage: The ratio of aces to total serves, showing how often a player or team scores directly from their serve.
Error percentage: The ratio of service errors to total serves, showing how often a player or team makes a mistake while serving.
Ace to error ratio: Measures a player's serving effectiveness by comparing the number of aces they make to the number of service errors they commit.
Passing
Pass rating: Receptions are judged on a three or four-point scale (0 being worst and 3 or 4 being best).
Perfect pass percentage: Number or receptions that are considered perfect.
Good pass percentage: Number of receptions that are considered perfect or good (2 pass).
Error percentage: Number of reception errors.
Understanding these metrics allows coaches to make data-backed decisions about serving strategies and passing formations.
Siding Out vs. Transition Analysis
Understanding the difference between sideout offense and transition offense is crucial to evaluating a team’s efficiency. These phases require different strategies, tempos and decision-making—so tracking performance separately gives coaches a clearer path to improvement.
Offense (Sideout Focus)
Side out percentage: The rate at which a team successfully wins the point during rallies where they are siding out.
First ball kill: Refers to when a team scores a point on their very first attack after serve receive.
Attack distribution based on pass quality: Analyzes how a team varies its set choices depending on the quality of the pass.
Defense (Transition Focus)
First ball dig to transition kill percentage: Measures how often a team successfully scores a point on the first attack immediately following the first defensive dig.
Transition attacking efficiency: The attack percentage for an athlete or team when removing their first ball side out attacks.
In-System vs. Out-of-System Analysis
Recognizing whether a team is operating in-system or out-of-system will make identifying the quality of their offensive opportunities easier. In-system plays typically allow for faster tempos and more attacking options, while out-of-system situations demand adjustments and often limit choices. Tracking these scenarios separately reveals how well a team performs in certain situations.
Note: Kill percentage and error percentage are often evaluated in these skills as well— definitions are listed above in Basic Skill section.
In-System Offense
Attacking efficiency based on perfect pass: Player or team attacking efficiency based on a perfect pass.
Medium-Pass Offense
Attacking efficiency based on medium pass: Player attacking efficiency based on a medium pass.
Out-of-System Offense
Attacking efficiency based on poor pass: Player attacking efficiency based in a medium or poor pass.
Rotation and Lineup Metrics
Each rotation presents unique strengths and challenges based on player matchups and serve-receive patterns. By analyzing performance across all six rotations, coaches can pinpoint which lineups are most effective—and where adjustments are needed. This level of detail helps optimize substitutions, serve strategies and scoring runs.
Note: All statistics listed above can be evaluated by rotation as well.
Overall scoring percentage: Total points won in this rotation.
Point scoring percentage: Points won when serving in this rotation.
Side out percentage: Points won when receiving in this rotation.
Earned side out percentage: Points won when receiving excluding opponent serve errors.
First ball side out percentage: Points won on first ball attack in side out.
Earned first ball side out percentage:Points won on first ball attack in side out, excluding opponent serve errors.
Box score stats: A quick view of the most common stats someone would want to see.
Rotational stats: Break down team performance by each rotation to uncover strengths, weaknesses and scoring patterns.
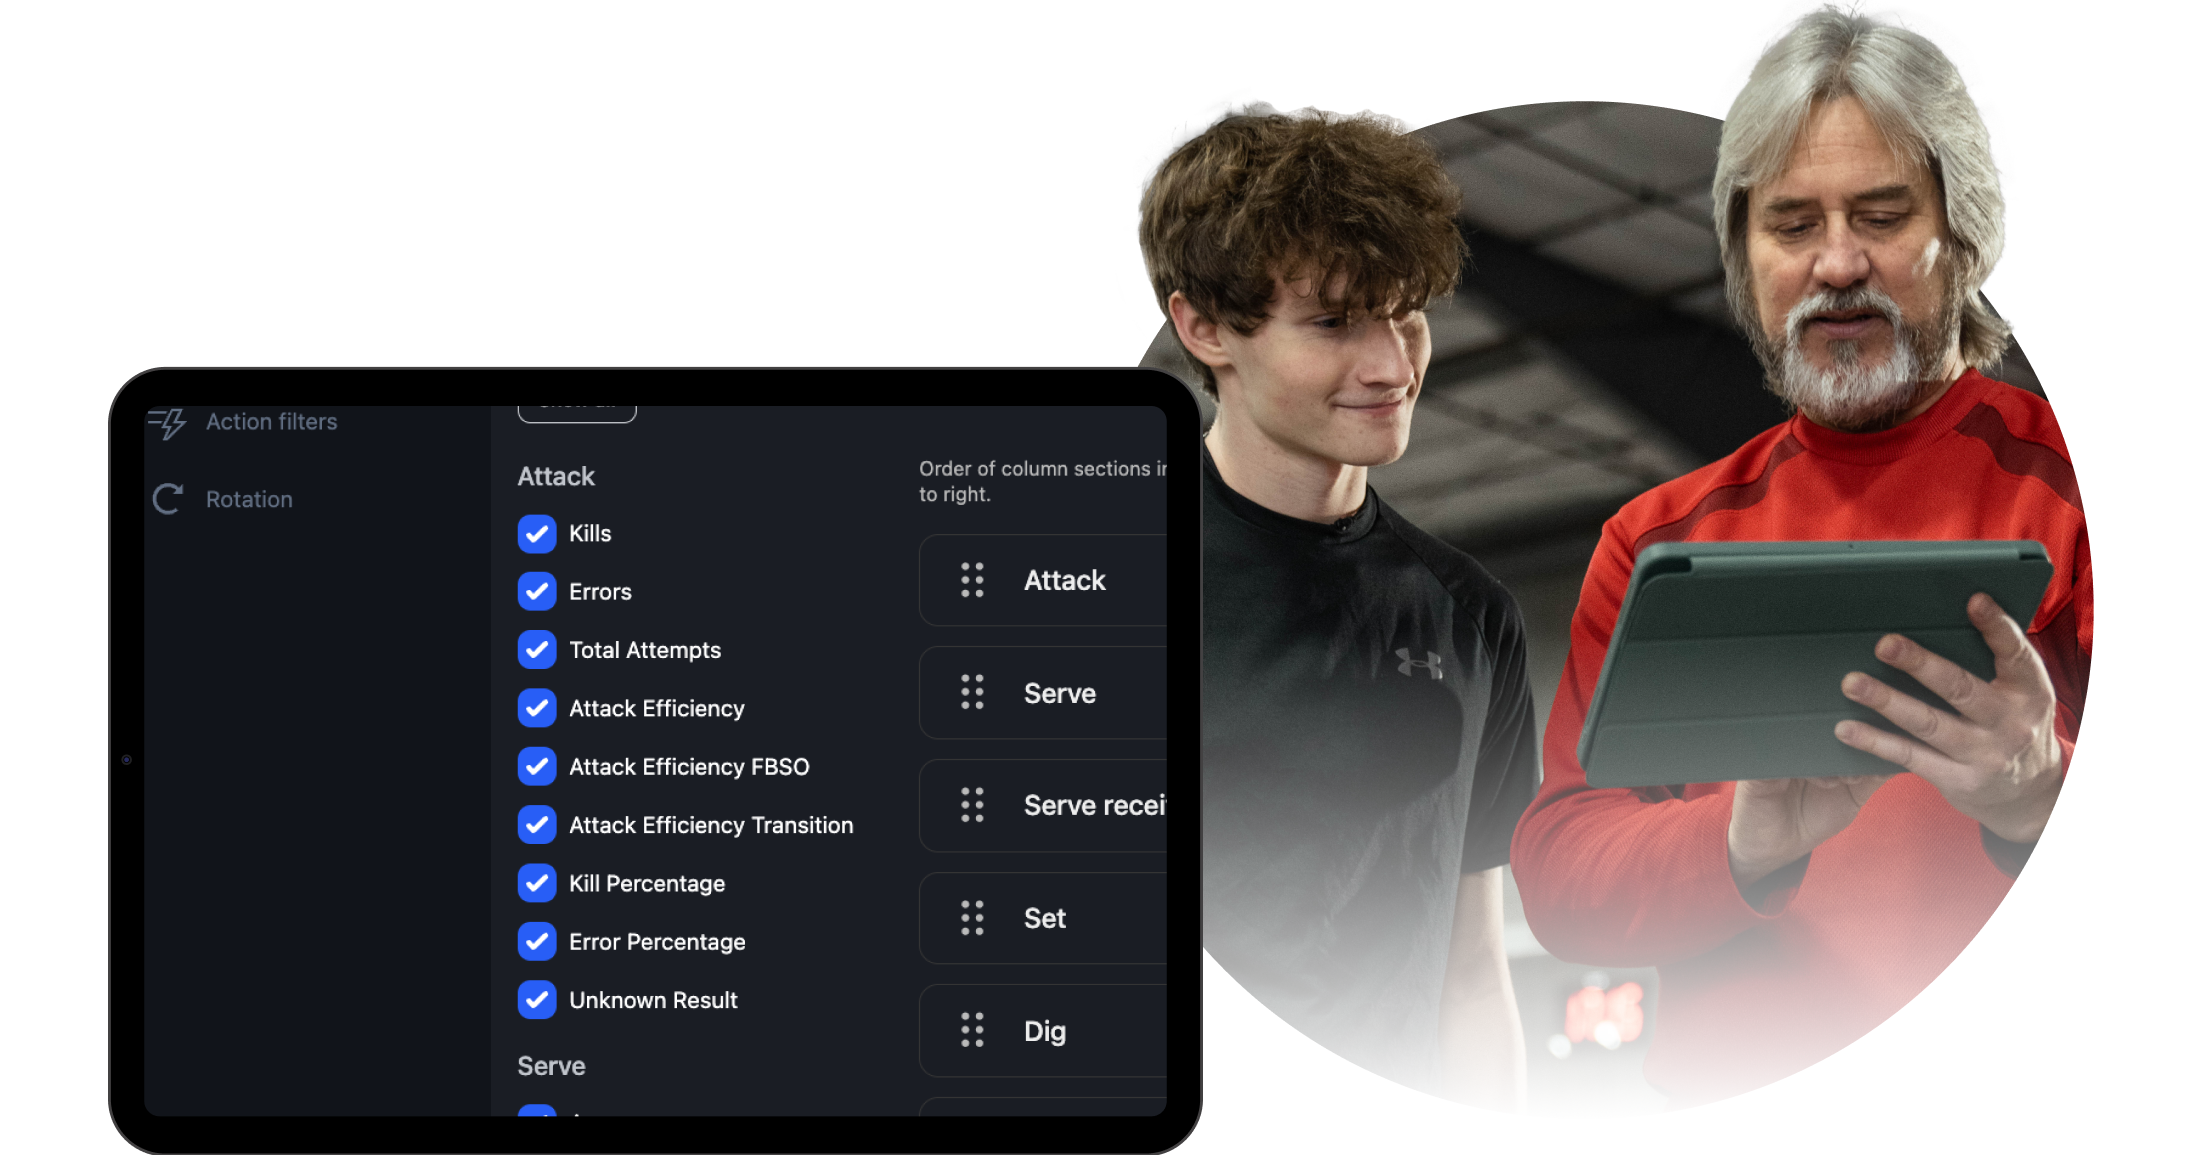
Tendencies: Uncover patterns across every skill—attacking, serving and more. Use interactive shot charts and filters to see where actions happen most often and how they impact performance. This is perfect for scouting opponents or refining your own team’s habits.
Seamless filtering: Instantly sort data by player, rotation, skill or match—no spreadsheet work required. Quickly surface the insights you need to make smarter decisions, faster.
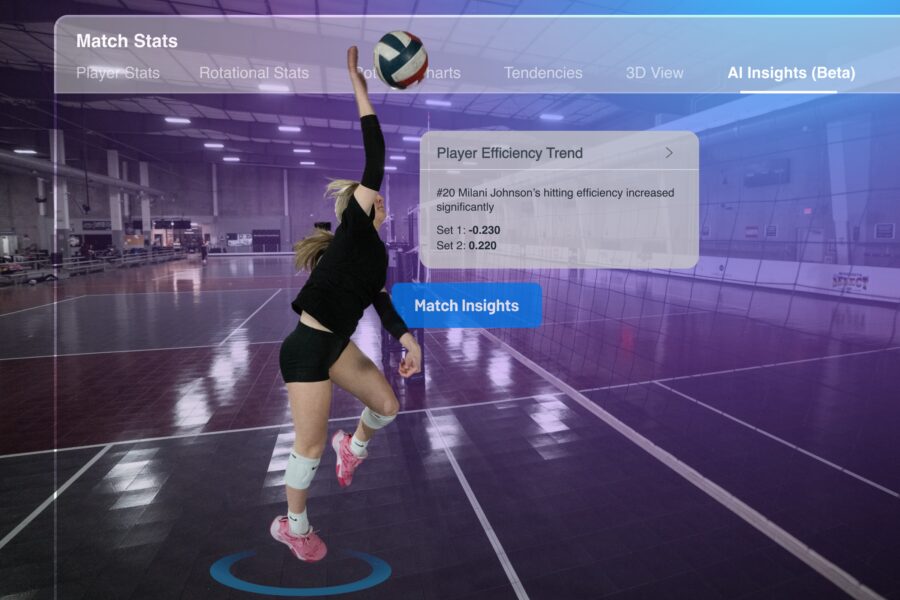
AI Features
Heat maps: Get a visual breakdown of where actions happen most often—like attack zones, serve targets and dig locations. Spot trends at a glance and adjust strategy with confidence.
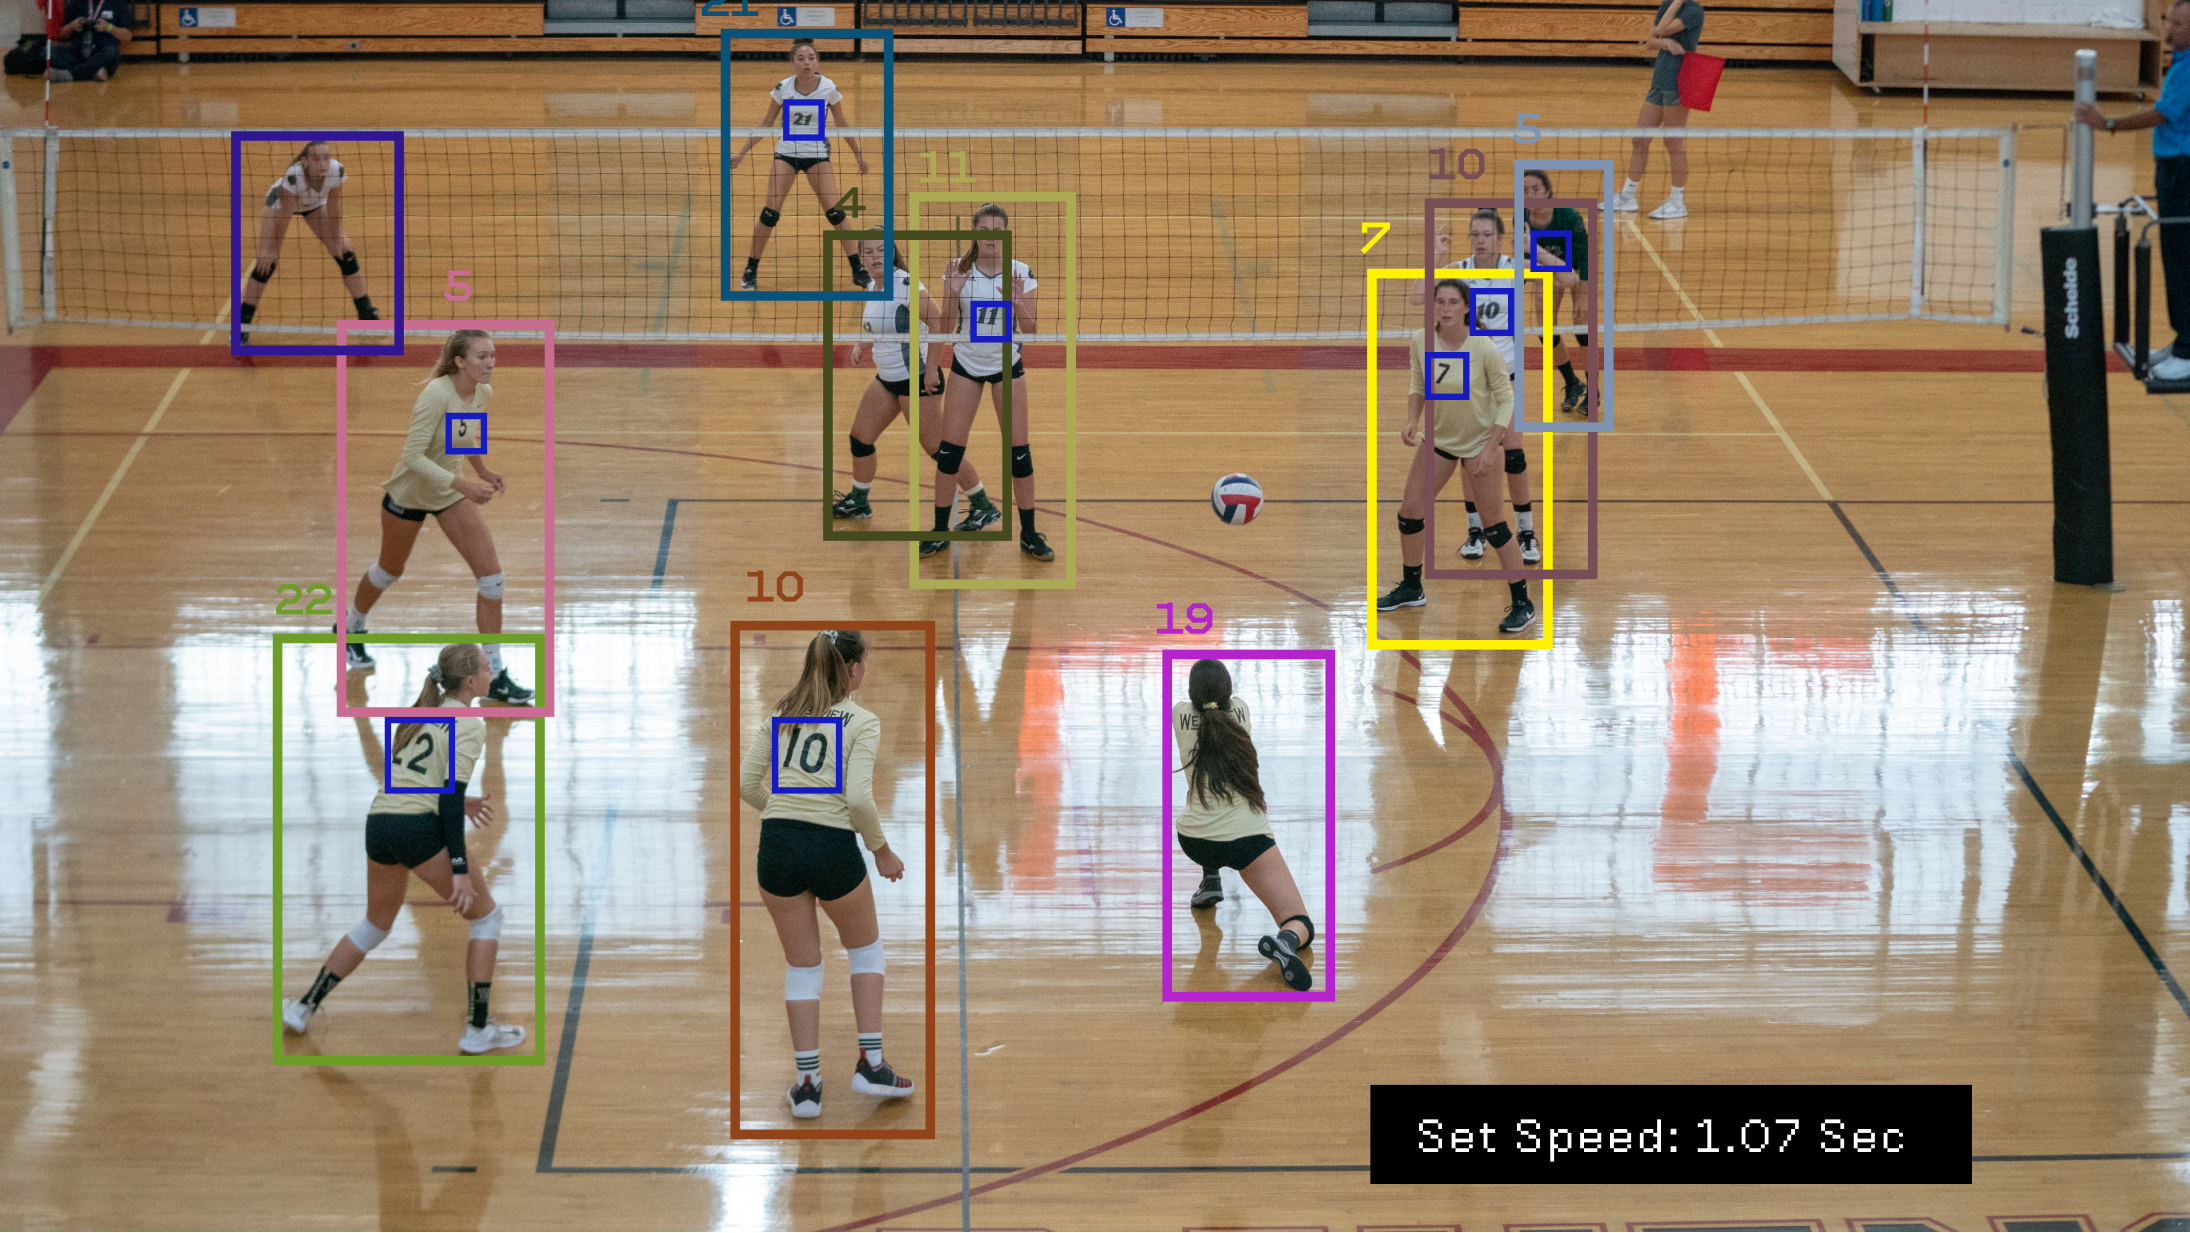
3D map: See the game like never before with an interactive court view that shows exactly where every touch happened—from attacks to digs to serves. A powerful tool for analyzing spacing, decision-making and player movement in real context.
Trajectories: Track the exact paths of sets, serves and digs to analyze speed, height and placement. Helps players and coaches understand ball movement for improved precision and smarter in-game decisions.
Attack height: Shows the vertical point where a player makes contact with the ball on each attack. Track how attack height fluctuates throughout the match and analyze situational swings to understand performance under pressure. Also, great for coaches who want to measure how high an athlete is reaching to optimize training and strategy.
Speed overlay: See the velocity of serves, sets and attacks layered over your video. This helps identify which plays pack the most power and how speed changes impact performance, which gives coaches an edge in game planning and player development.
Comparing AI Stats vs. Traditional Tagging
Speed and Scale of AI vs. Detailed Human Tagging
The primary advantage of AI statistics is processing speed and volume.
AI Tagging
Full match processed in 1-2 hours
Can process entire season retrospectively
Consistent application of criteria
Human Tagging
Full detailed tagging takes 8-10 hours
May vary between different taggers
Superior for contextual evaluations
How to Know Which Is Right for You
Choosing the right analytics approach depends on several factors:
Technical resources: Some systems require dedicated hardware or specialized cameras
Staff availability: AI-only breakdowns sometimes require a time investment for refinement of stats
Learning preferences: Some coaches and players respond better to different data presentations
AI-tracked volleyball statistics have transformed from a competitive advantage to a competitive necessity. By understanding where these stats come from, which metrics matter most, and how to apply them in practical coaching situations, you can leverage these powerful tools to elevate your team's performance.
Whether you're just starting with basic analytics or building a comprehensive data ecosystem, the insights provided by AI will help you make better decisions, optimize player development, and create more effective game strategies.