Hudl Statsbomb Launches New HOPS Metrics and Set Piece Model
11 Mar 2026
7 min Read
From aerial unit ratings to phase-specific set piece analysis, our upgrades to HOPS and Set Pieces help you find advantages your rivals are missing.
At Hudl Statsbomb, we pride ourselves not only on offering the most accurate and in-depth data in the industry, but on developing new models from our world-class data science team and consistently updating them to anticipate the demands of modern football.
That’s why we’re pleased to announce that we’re releasing new Header Orientated Performance System (HOPS) metrics and an upgraded Set Pieces model to the Hudl Statsbomb API.
Working individually or together, they offer analysts a raft of new metrics designed to derive better and more complete insights that enhance player recruitment, analysis, and set-piece design.
Elevating HOPS: New Metrics for Aerial Analysis
Analysts don’t just want to know if a player won an aerial duel — they want to know how difficult that duel was. But without the context of the single most important variable – opponent quality – basic aerial stats were unable to tell the full story.
That's why we built HOPS back in 2023. We realised the need for a model that went beyond the standard measures of Aerial Wins per 90 and Aerial Win % and took into account the aerial ability of the opposing duellist in order to credit the winner of the duel appropriately.
HOPS worked. Analysts finally had a way of comparing Virgil van Dijk to, well, anyone who wasn’t Virgil van Dijk.
But football constantly evolves – and so do the questions that analysts ask us. For example, can we measure a team's entire aerial unit, not just individual players? Can we quantify how hard a defender's aerial task actually was?
Our data experts got to work. Metaphorically speaking, they've been box jumping, pin squatting, and single-leg hopping to ensure HOPS reaches new heights.
As part of the launch, HOPS is now available in the Hudl Statsbomb API and also includes the following new metrics:
HOPS Rating (Normalized): A standardized 0−1 aerial skill rating for pre-match matchup analysis.
HOPS Raw Rating: The raw rating value used for precise duel probability computations.
Duel Win Probability: The probability (0−1) of a player winning a specific duel based on the HOPS states of the participants.
xHeaders (Match & Season): The sum of duel win probabilities for all aerial duels contested by a player.
Aerial Duel Difficulty: The average likelihood of an opponent winning aerial duels faced by a team.
Aerial Unit Rating: A time-weighted average rating of a team’s top 5 aerial players on the pitch.
Aerial Team Rating: A time-weighted average rating of all 11 players on the pitch, representing overall squad solidity.
Let’s take a look at how these new metrics work in practice, using Aerial Unit Rating in a real-life context.
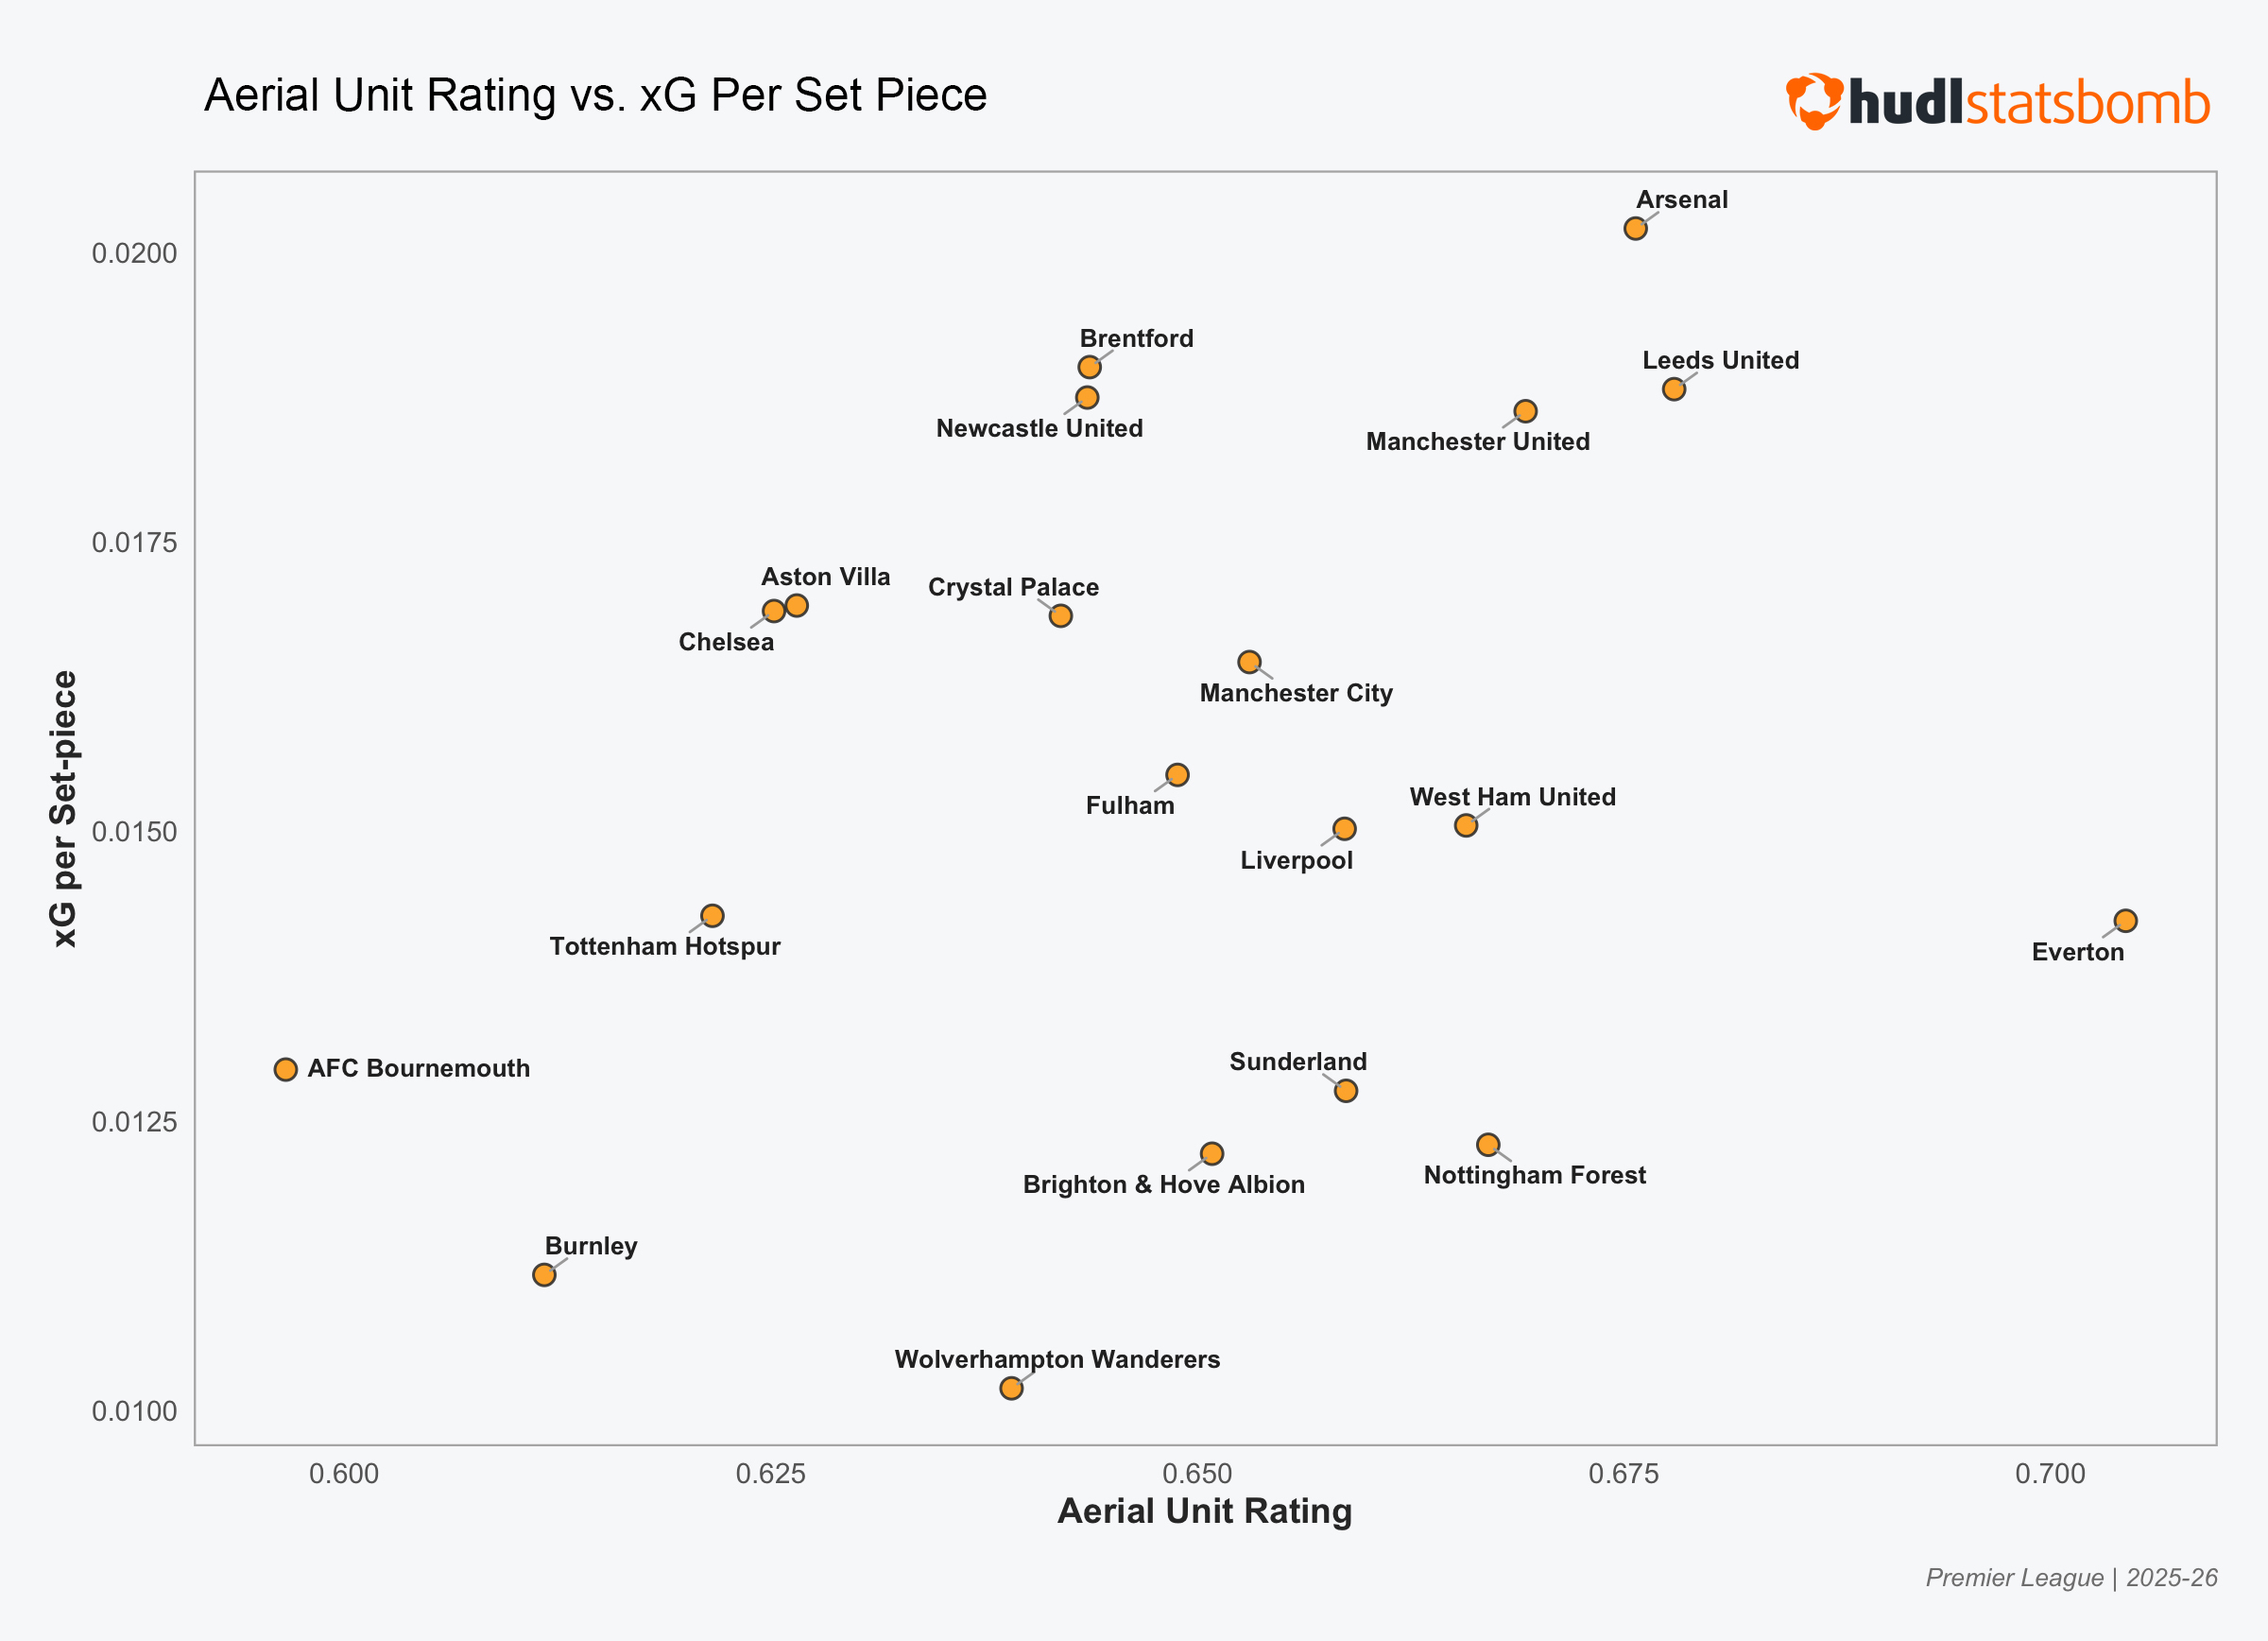
By comparing Aerial Unit Rating against xG per Set Piece, we can see that Arsenal have both one of the highest Aerial Rating and are top for xG per SP – an indication that they are converting their raw aerial power into high quality chances.
However, both Brentford and Newcastle have lower Aerial Ratings (12th and 13th, respectively) but teams posting among the highest in the league. This strongly suggests that tactical positioning, delivery quality, and movement patterns are far more influential than aerial dominance in the current set-piece model.
Conversely, Everton leads the league in Aerial Unit Rating but fall into the middle of the pack for efficiency, implying their ability to win aerial duels isn't being fully converted into high-probability scoring chances.
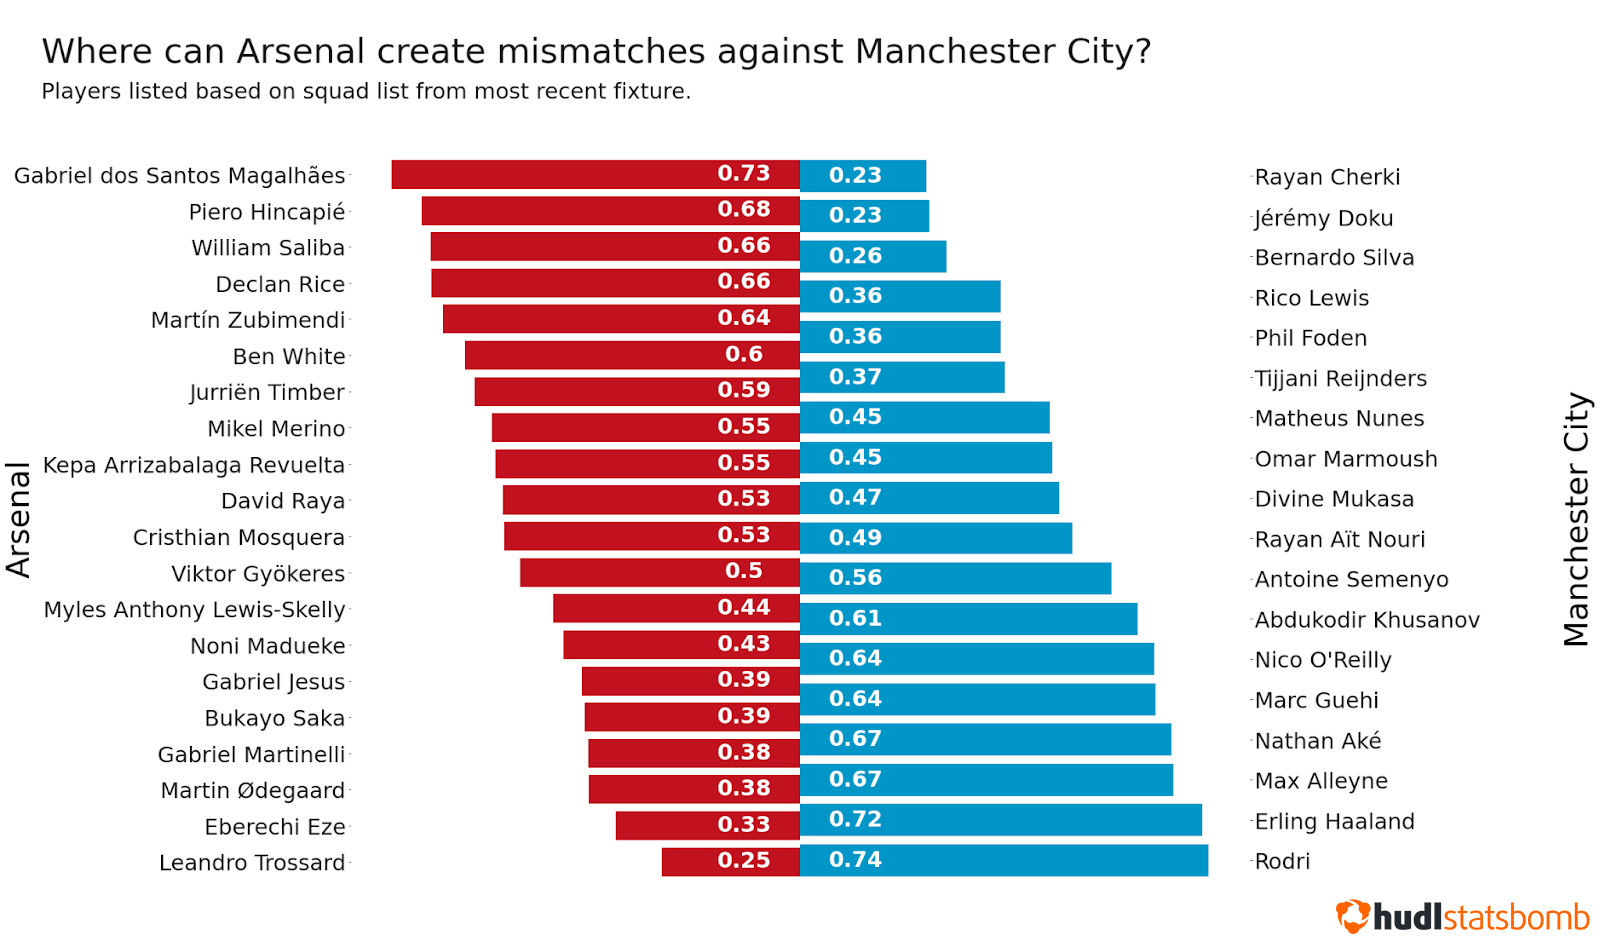
In practice, the biggest aerial threats tend to be paired off against each other. But what if they’re not? By comparing individualised HOPS Ratings against your opponent’s squad, analysts can highlight potential mismatches to exploit
Of course, aerial ability doesn't exist in a vacuum. Where do the most elite aerial players earn their keep? Set pieces. Which brings us to our second upgrade…
Set Piece Model Upgrade: Phase-Specific Analysis
Set-piece analysis has evolved rapidly — and so have the questions analysts are asking. While traditionally they’ve been able to use video to separate first-phase delivery from the second-phase, this took time. Lots of it. The real challenge is getting to those insights quicker.
Working with customer feedback, we've upgraded the Set Piece model to solve this: it captures more set-piece chances (especially previously missed second-phase opportunities) and delivers phase-specific analysis immediately, not after hours of video review..
Built on labels from our expert analysts and designed for continuous retraining, our dynamic model combines deep football knowledge with machine learning. The model's architecture enables continuous improvement: incorporating further customer feedback and adapting to new tactical trends as set-piece strategies become increasingly sophisticated.
The key shift is moving away from time-based windows to context-aware models that actually understand the play. The hard facts — corners taken, free kicks awarded, throw-ins — stay completely untouched. What's changed is the intelligence layered on top.
As part of the launch, the following new Set Piece metrics are now available:
Indirect Free Kicks: Previously bundled in with general free kicks and now - finally - their own distinct category. Includes Counts, Goals, Shots, and xG for both attacking and defensive phases.
Efficiency Ratios: We've automated the performance ratios analysts were calculating manually anyway. For every set piece category - Corners, Throw-ins, Direct and Indirect Free Kicks - the API now delivers xG per Set Piece, Shot Ratio, and Goal Ratio out of the box.
Expanded Field Mapping: 30 new calculated ratio fields and 70+ total mapped fields, including per-game averages in the Season endpoint. More data, less spreadsheet wrangling.
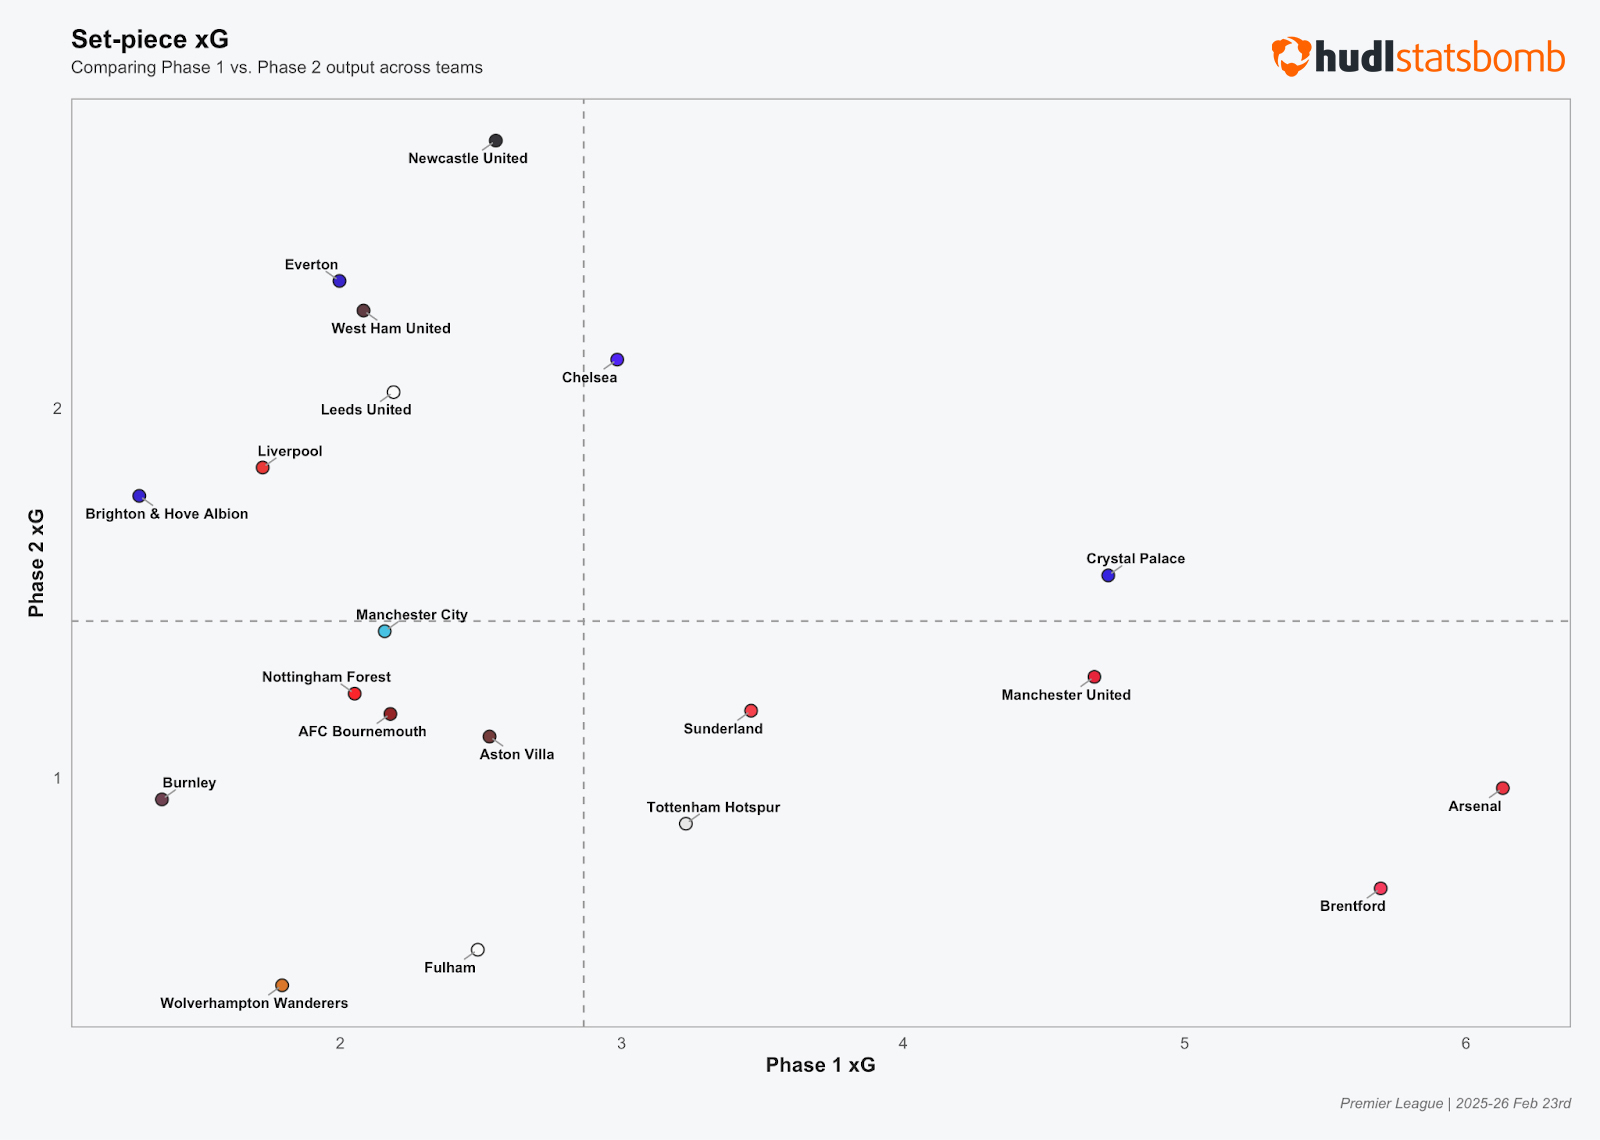
By distinguishing between first and second phases, we can gain a more nuanced idea of Set Piece effectiveness.
Looking at the xG created in this year’s Premier League season, we can see that Arsenal and Brentford are the league leaders in generating good quality opportunities from their initial routine. On the other hand, Newcastle provide an interesting counterpoint, getting more joy from their second phase to create high value goal-scoring chances but struggling on their first attempt.
This only scratches the surface of what can be analysed with the new model. You can split any metric across both phases and also look at which teams spend the most time in phase 1 and 2, for example.
Strength vs Strategy: Where HOPS Meets Set Pieces
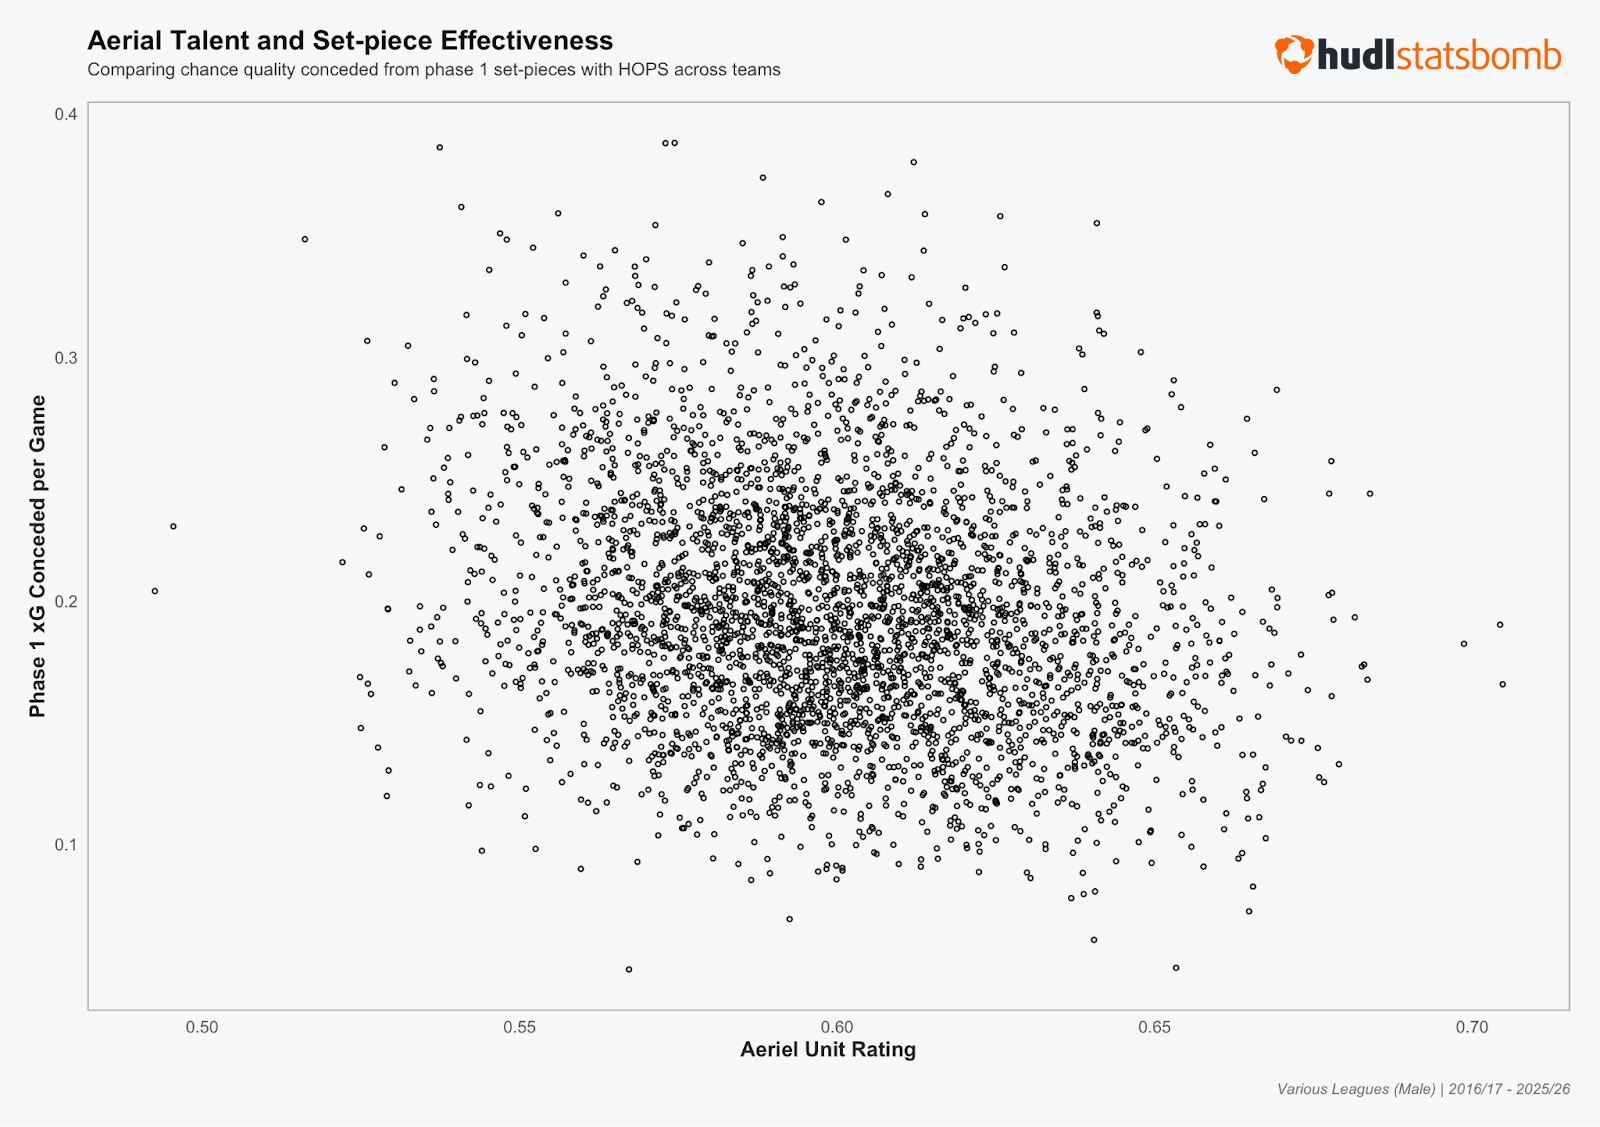
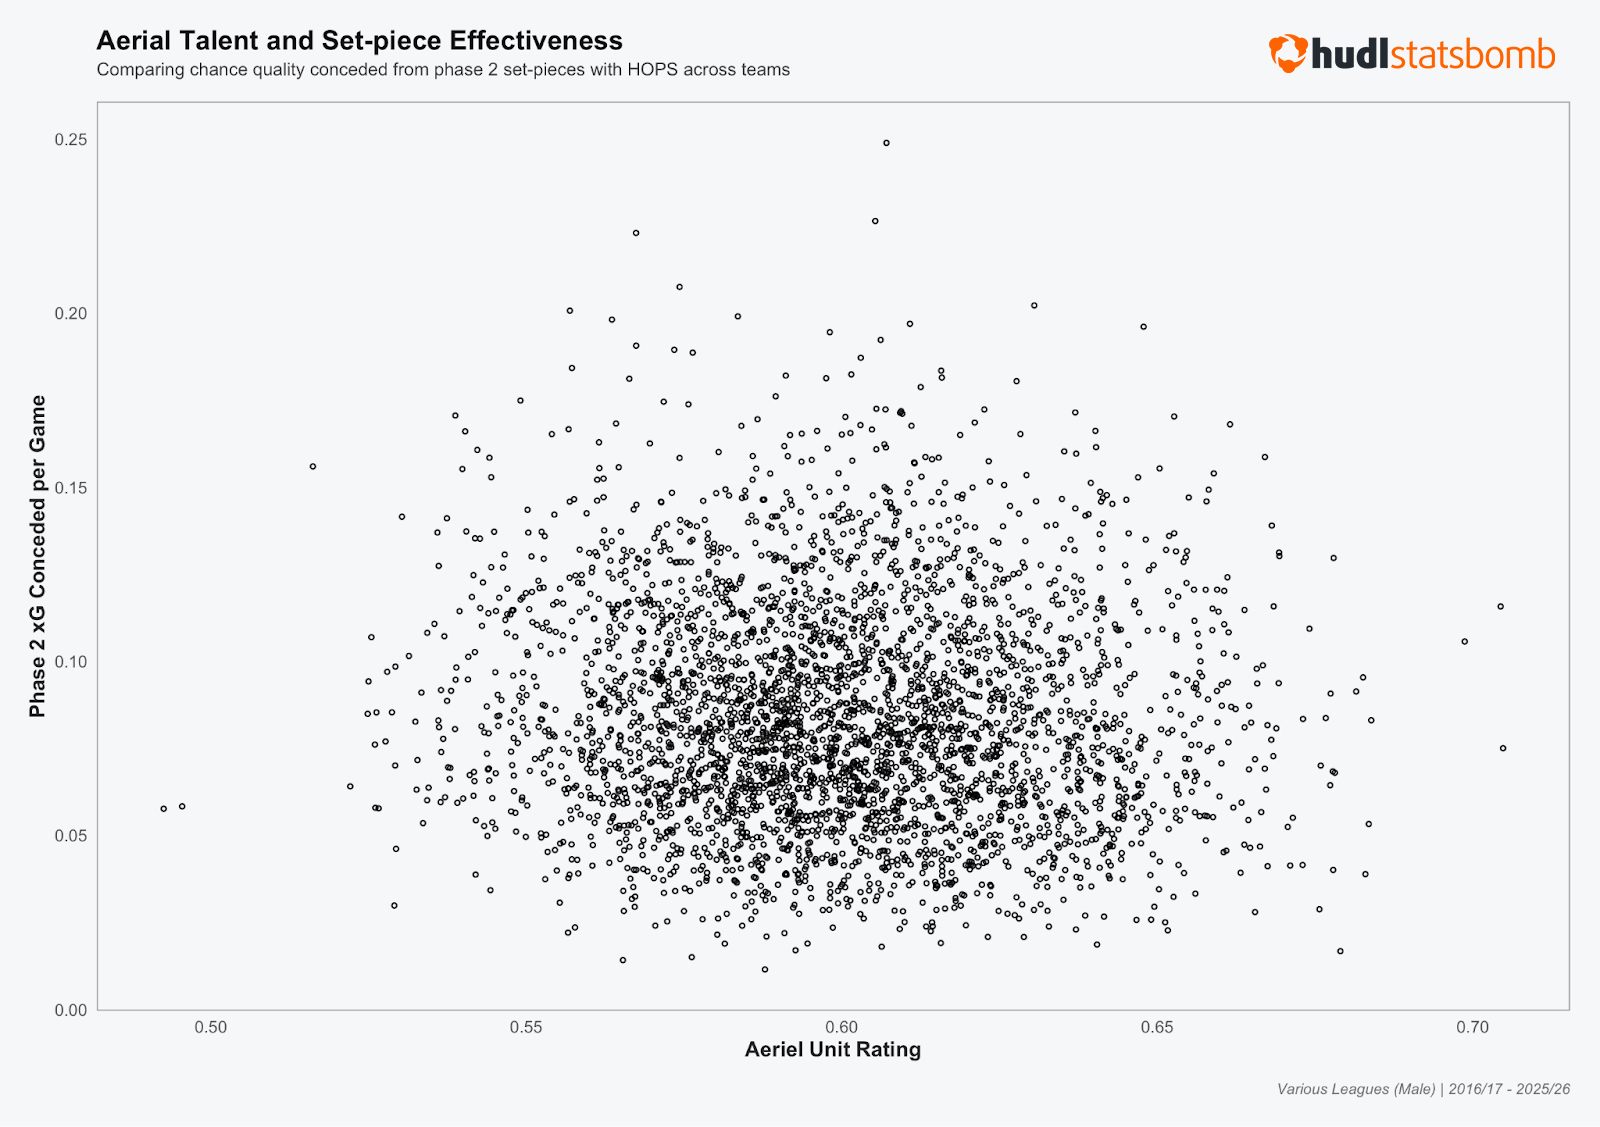
So, the question is: does having an aerially dominant defensive unit correlate to fewer goals conceded at set pieces?
The temptation might be to build a team stacked full of HOPS monsters. But the data shows it’s not that simple.
When we plot Aerial Unit Strength against Phase 1 and Phase 2 xG Conceded, we can see that the relationship isn't linear. Having the most dominant aerial duelers on the pitch doesn't mean you’re going to give up fewer chances from set pieces.
Aerial Unit Strength alone isn’t a silver bullet to stop set-piece goals — how you organise to prevent free men and mismatches remains key to success.
This is where the new HOPS metrics and upgraded Set Pieces model come into play. They separate the ‘what’ from the ‘how’. You’ve got the aerial dominance in your backline. Great. But are you organising to neutralise their threats? Are they exploiting you in Phase 1 delivery or relying on second-ball chances? Are your best aerial duelers marking their most dangerous players – or are mismatches being exploited?
Used together by a dedicated analysis resource, these models help you find even greater edges: the tactical inefficiencies your opponents haven't spotted yet, and the mismatches in your own setup you didn't know existed.
These upgrades are available at no additional cost and are now available in Hudl Statsbomb Match, Season, and Competition APIs. In the coming weeks and months, these metrics will be available and linked to the associated video in our analysis platform.
Want to see how your team's aerial unit stacks up? Curious where you can find the edge in your set-piece routine? The data's ready when you are.
Full documentation and details of what’s available in each new API can be accessed via the Hudl Statsbomb Datahub.