 :
"After meeting with some mentors, they let me know that the reason why I'm here is to give my diverse opinion, my unique perspective on something."
:
"After meeting with some mentors, they let me know that the reason why I'm here is to give my diverse opinion, my unique perspective on something."
Gabby Delos Reyes, Engineer II
Full-Time Employees
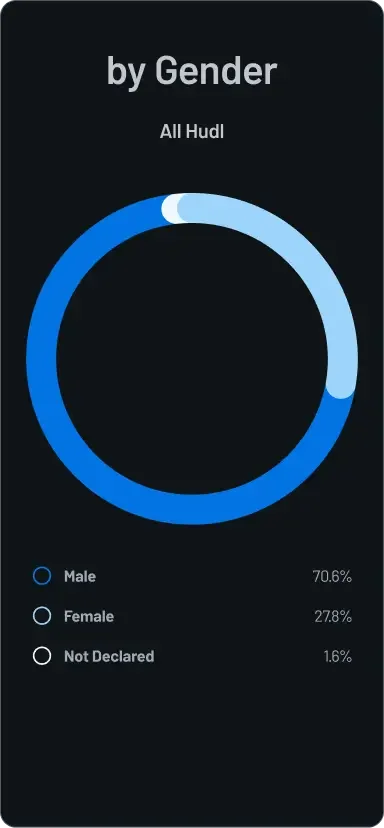
Full-Time Employees by Gender
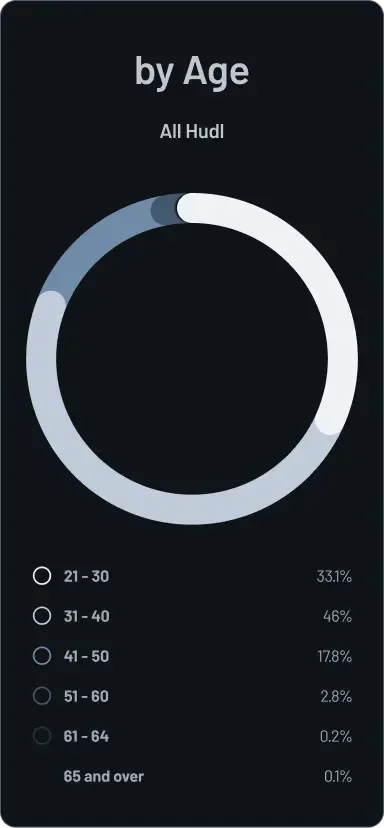
Full-Time Employees by Age
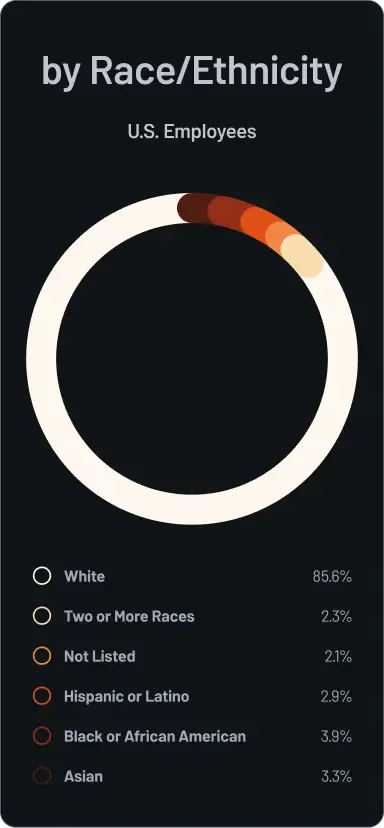
Full-Time Employees by Race
Interns
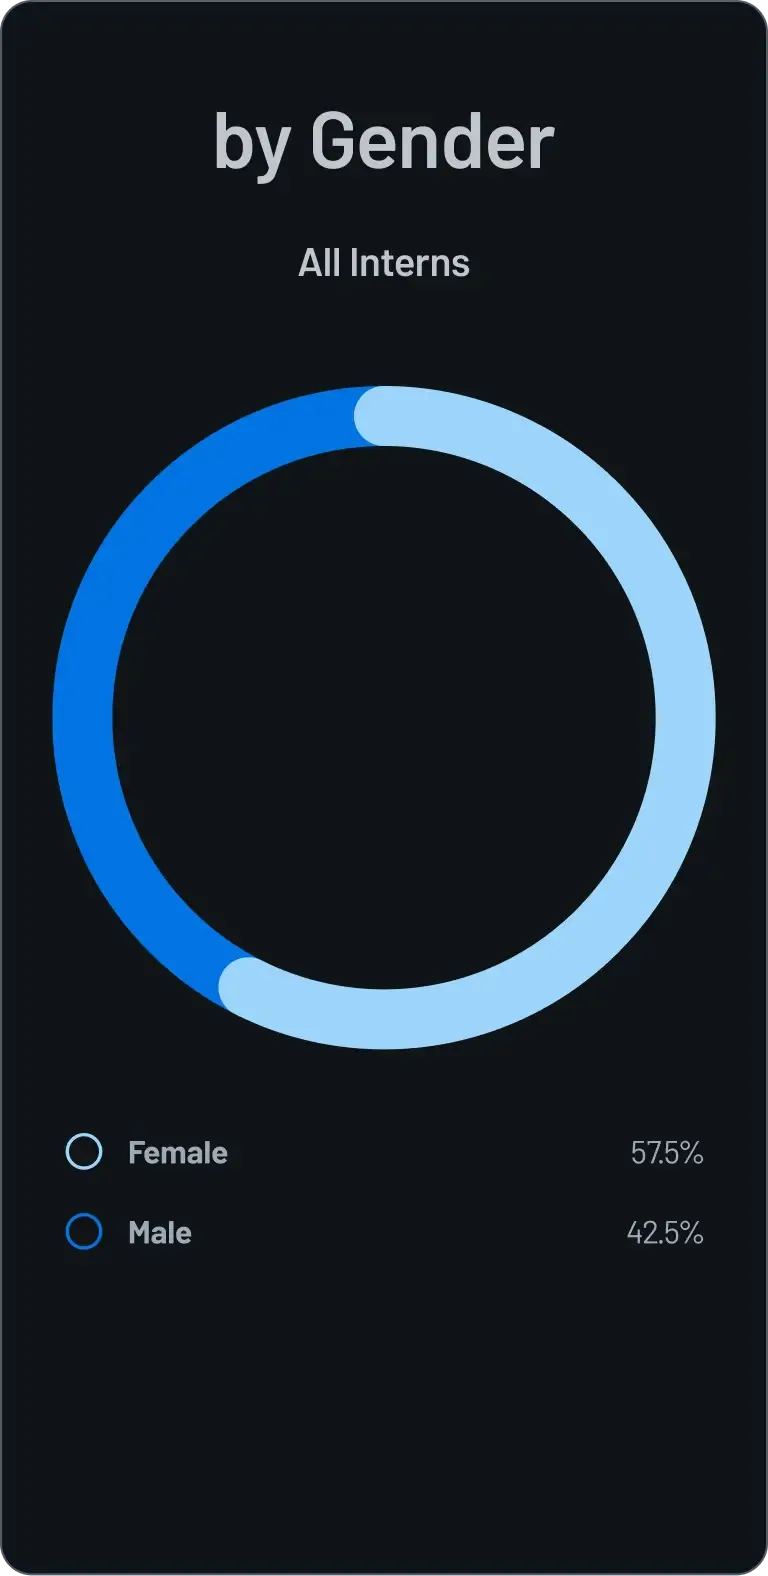
Interns by Gender
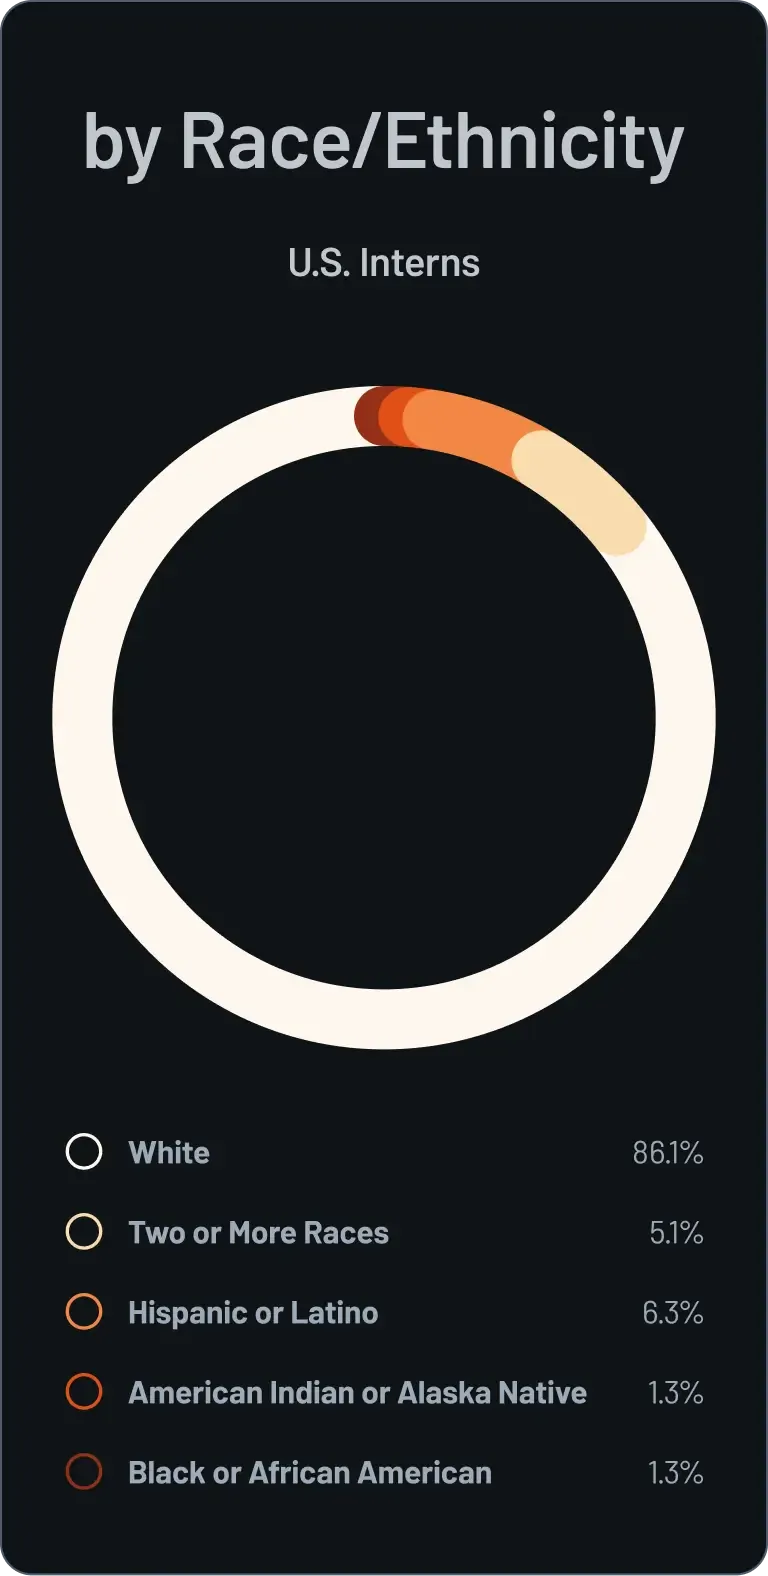
Interns by Race
Interns by Race