Some players just play better together. Lineup data will help you pinpoint the right combinations.
Basketball is simply a sport that requires the right chemistry. Sometimes certain groups of players perform better with one another—your five most talented athletes may not be your most lethal combination.
That’s why lineup data is such an important statistic. Even if that cohesion is easy to spot from the sidelines, it’s always useful to have the data to back up your hypothesis. With these metrics, you have that power.
“What I see in the data sometimes points out errors in the ways that I think,” Rob Brost, head coach at Bollingbrook High (Ill.), said. “That is my first red flag, like ‘Maybe I’ve got the wrong lineup out here.’ You can look and say, ‘We had lineup A out there in crunch time and it wasn’t very effective. But in the next game, we had a different group out there and that group was much more effective.’”
How It Works
Lineup data, and all the information it comes with, is aggregated based on the combination of players you have in the game.
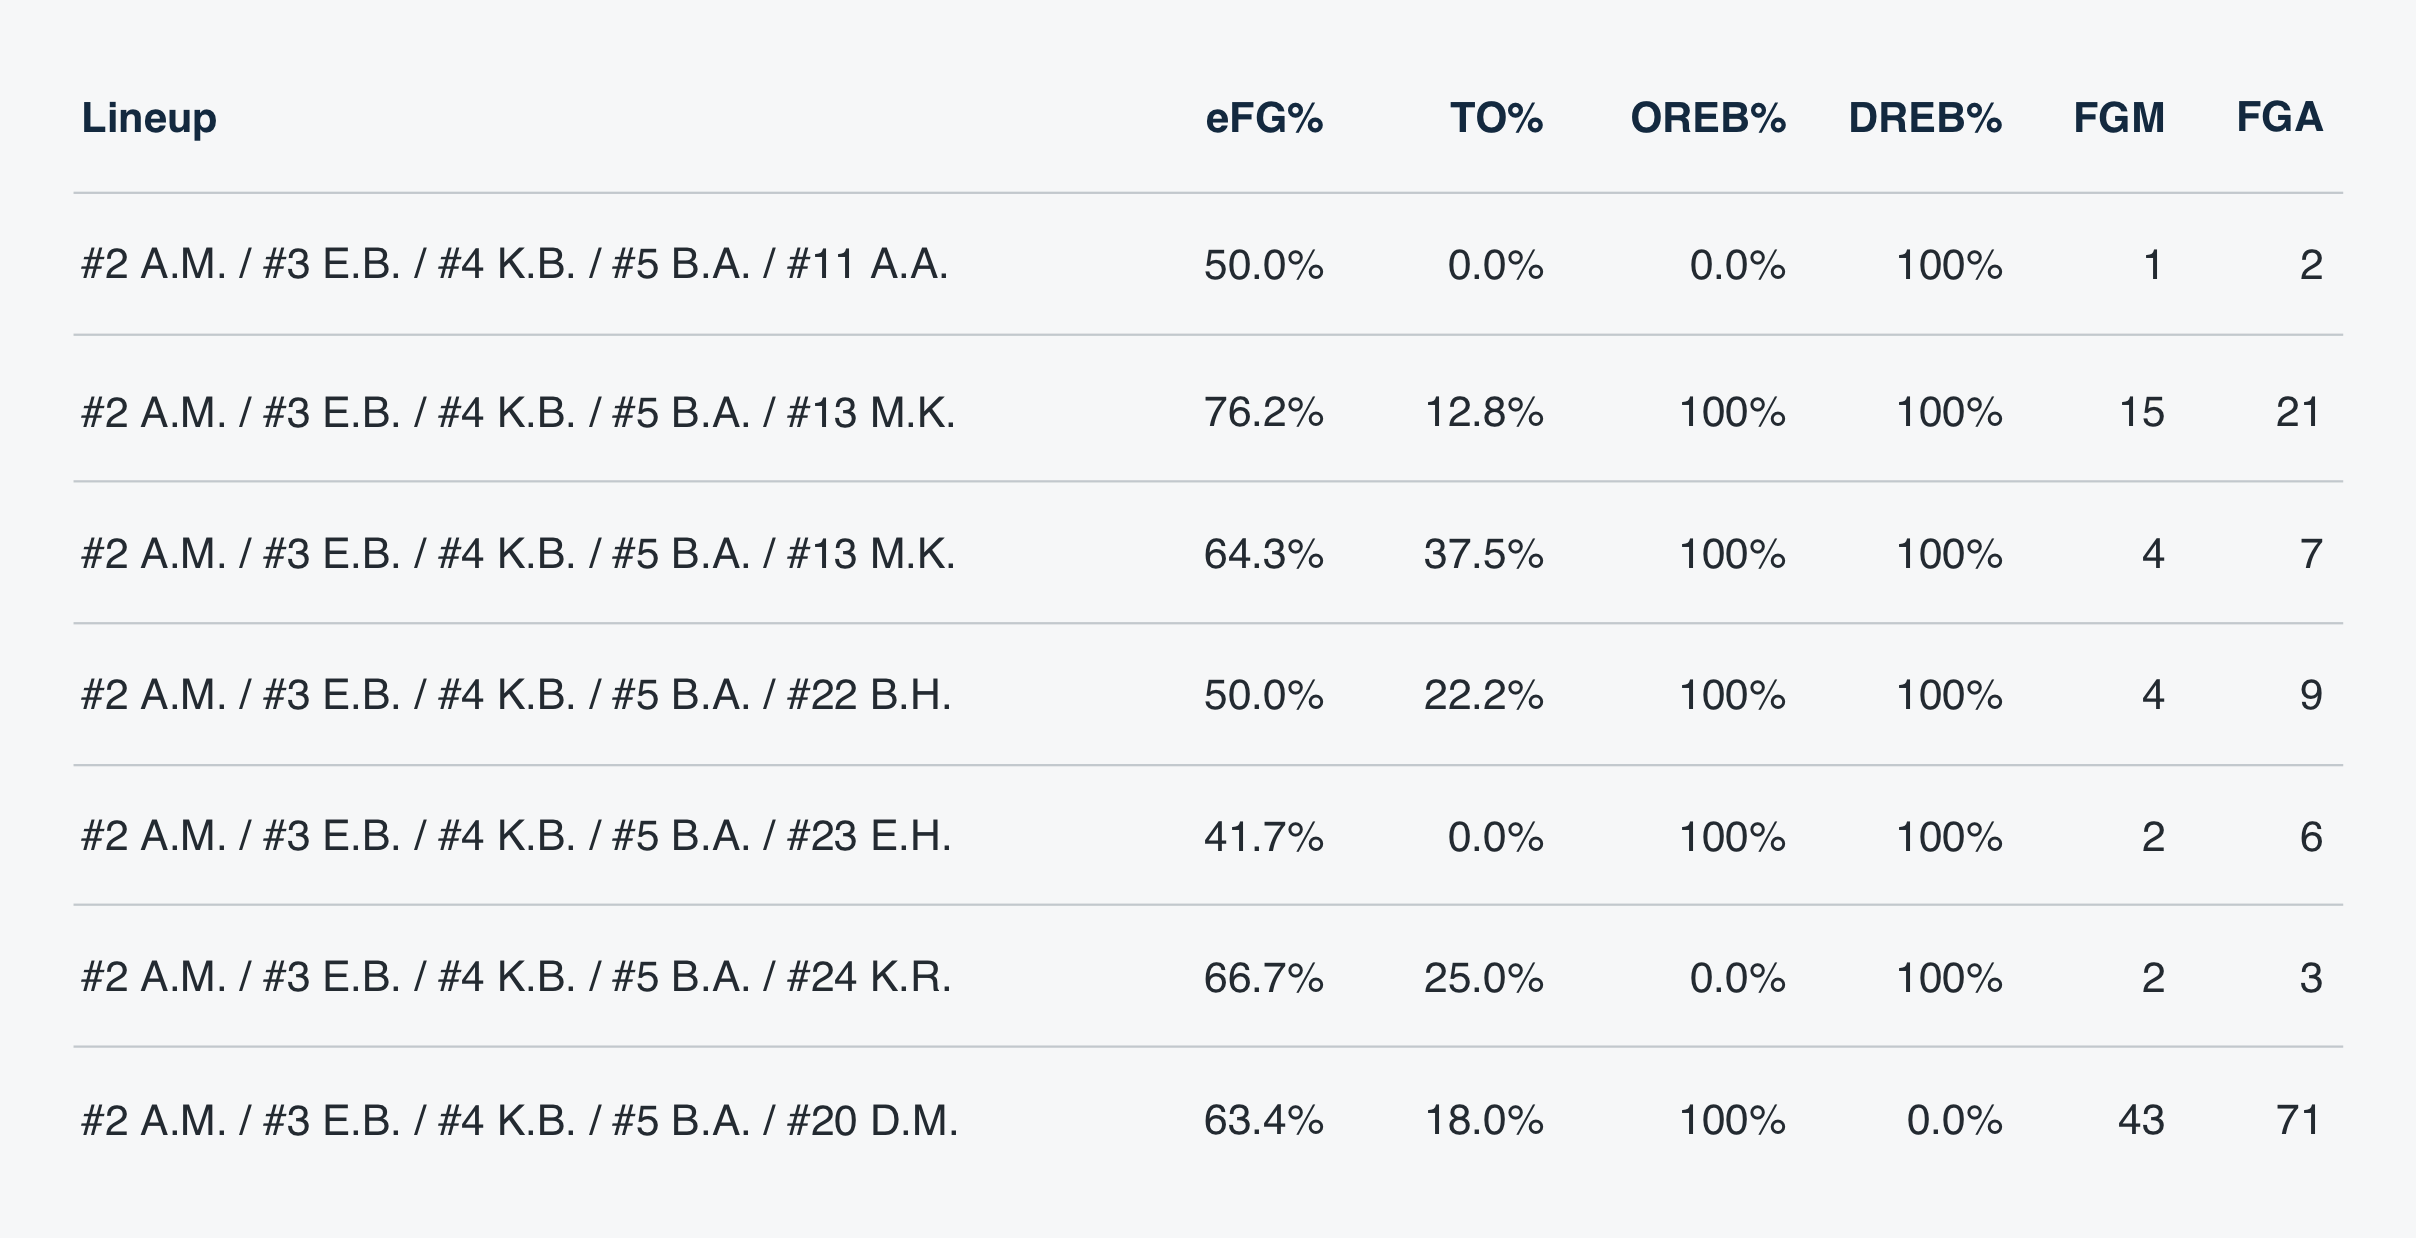
Here’s an example of how lineup data is typically sorted.
Let’s say you have the ball with 10 seconds left, no shot clock, and a tied game. You call a timeout. If you look at the data, which of these lineups will give you the best shot at winning the game?
How Coaches Value It
When you’re in the heat of battle, you don’t always have time to make the right decision. Understanding the strengths and weaknesses of each lineup, backed by data, helps coaches know what substitutions to make for specific game scenarios.
“I’m used to watching film, but to able to break it down by player, the analytics have been amazing,” said St. Johns Country Day (Fla.) girls basketball coach Yolanda Bronston. “I know which lineup is my scoring lineup. I know which lineup to put in when I need steals. At the end of the game, when we need to hit free throws, I know the best lineup to put in for free throw percentage. We use it for everything."
Lynden Christian (Wash.) girls basketball coach Brady Bomber recalled a recent season where lineup data revealed a boundless energy level with a certain bench player. “She just made things happen,” he said.
“We just felt that this girl was an impact in the game at a high level, so we thought we might need to get her into the game earlier, because we might be missing out on a chance to start fast.”
Staggering her minutes better made the Lynx have better starts. And tinkering with this throughout the season helped them run to two straight state finals, winning one.
How You Can Use It
Not all competition is the same. Looking at your lineup data based on how you did against your best opponents can give you shrewd solutions to your pain points. Going back to the chart from above, if you have one chance left to win it in regulation, you’re probably going with the lineup that boasted both the highest effective field goal percentage and lowest turnover percentage, right?
“That’s been a huge resource to us,” Bomber said. “Okay, let’s get out all the noise because that big win doesn’t tell us a lot about our team, and let’s look at these seven games and see what changes against the seven best teams we play.”
Don’t skip looking at the lineup numbers for upcoming opponents. A coach may have an objective in mind when he or she goes with a certain grouping, and by looking through the numbers, you can identify their thoughts and predict what they’ll do.
For example, another team may deploy a smaller lineup that ratchets up the ball pressure and forces a lot of turnovers. A corresponding move might be to insert your steadiest ball handlers and a few bigger players who can crash the offensive boards.
Like most stats, lineup data alone won’t tell the whole story. It can help uncover some combinations that should be playing together more often, but you have to combine that with what you see and know as a coach. The Value Point System, for instance, gives you an overall view of your most efficient lineups, but other stats prepare you for specific situations.
“You have to be open to information that you’re getting,” Bollingbrook (Ill.) coach Brost said. “Sometimes what you think in your head is not accurate, but you go with it anyway because you have a feeling that might work on a given night. You really need to combine the information that you get and the feel that you have, and some of that comes with experience.
“It’s not a coincidence that in each of the last four years we’ve won 20-plus games. All of that has come when we started to implement and use the data to better evaluate where we’re at.”
***
Fine-tuning your lineups takes time. But Hudl Assist cuts that time in half. Schedule a demo to learn how to get the most data out of your film in fewer hours.
Learn More | See a Demo