In football, the biggest question isn’t what just happened — it’s what’s about to happen. These signals predict goals across four key timescales.
In football, the biggest question isn't what just happened – it's what's about to happen.
Modern football analytics is excellent at describing the past, but far weaker at predicting what comes next. Expected goals measures the quality of each chance after it happens. On-ball value measures action impact, pitch control maps territorial dominance. Useful tools – but they describe what occurred, not what's building.
A high turnover in the final third. Progressive passes moving the ball through a retreating defence. A second goal arriving fifteen minutes after the first. These aren't isolated events – they're part of a sequence moving in a direction. Predictive analytics reads that direction.
The signals here don't require complex models – just recognising patterns in how the game unfolds. Knowing which moments carry more information than they appear to. This piece picks out four of them, each operating on a different timescale.
Spotting Goal Threats
Most goals feel like they come from nowhere. "Feeling like nowhere" and "coming from nowhere" aren't the same thing.
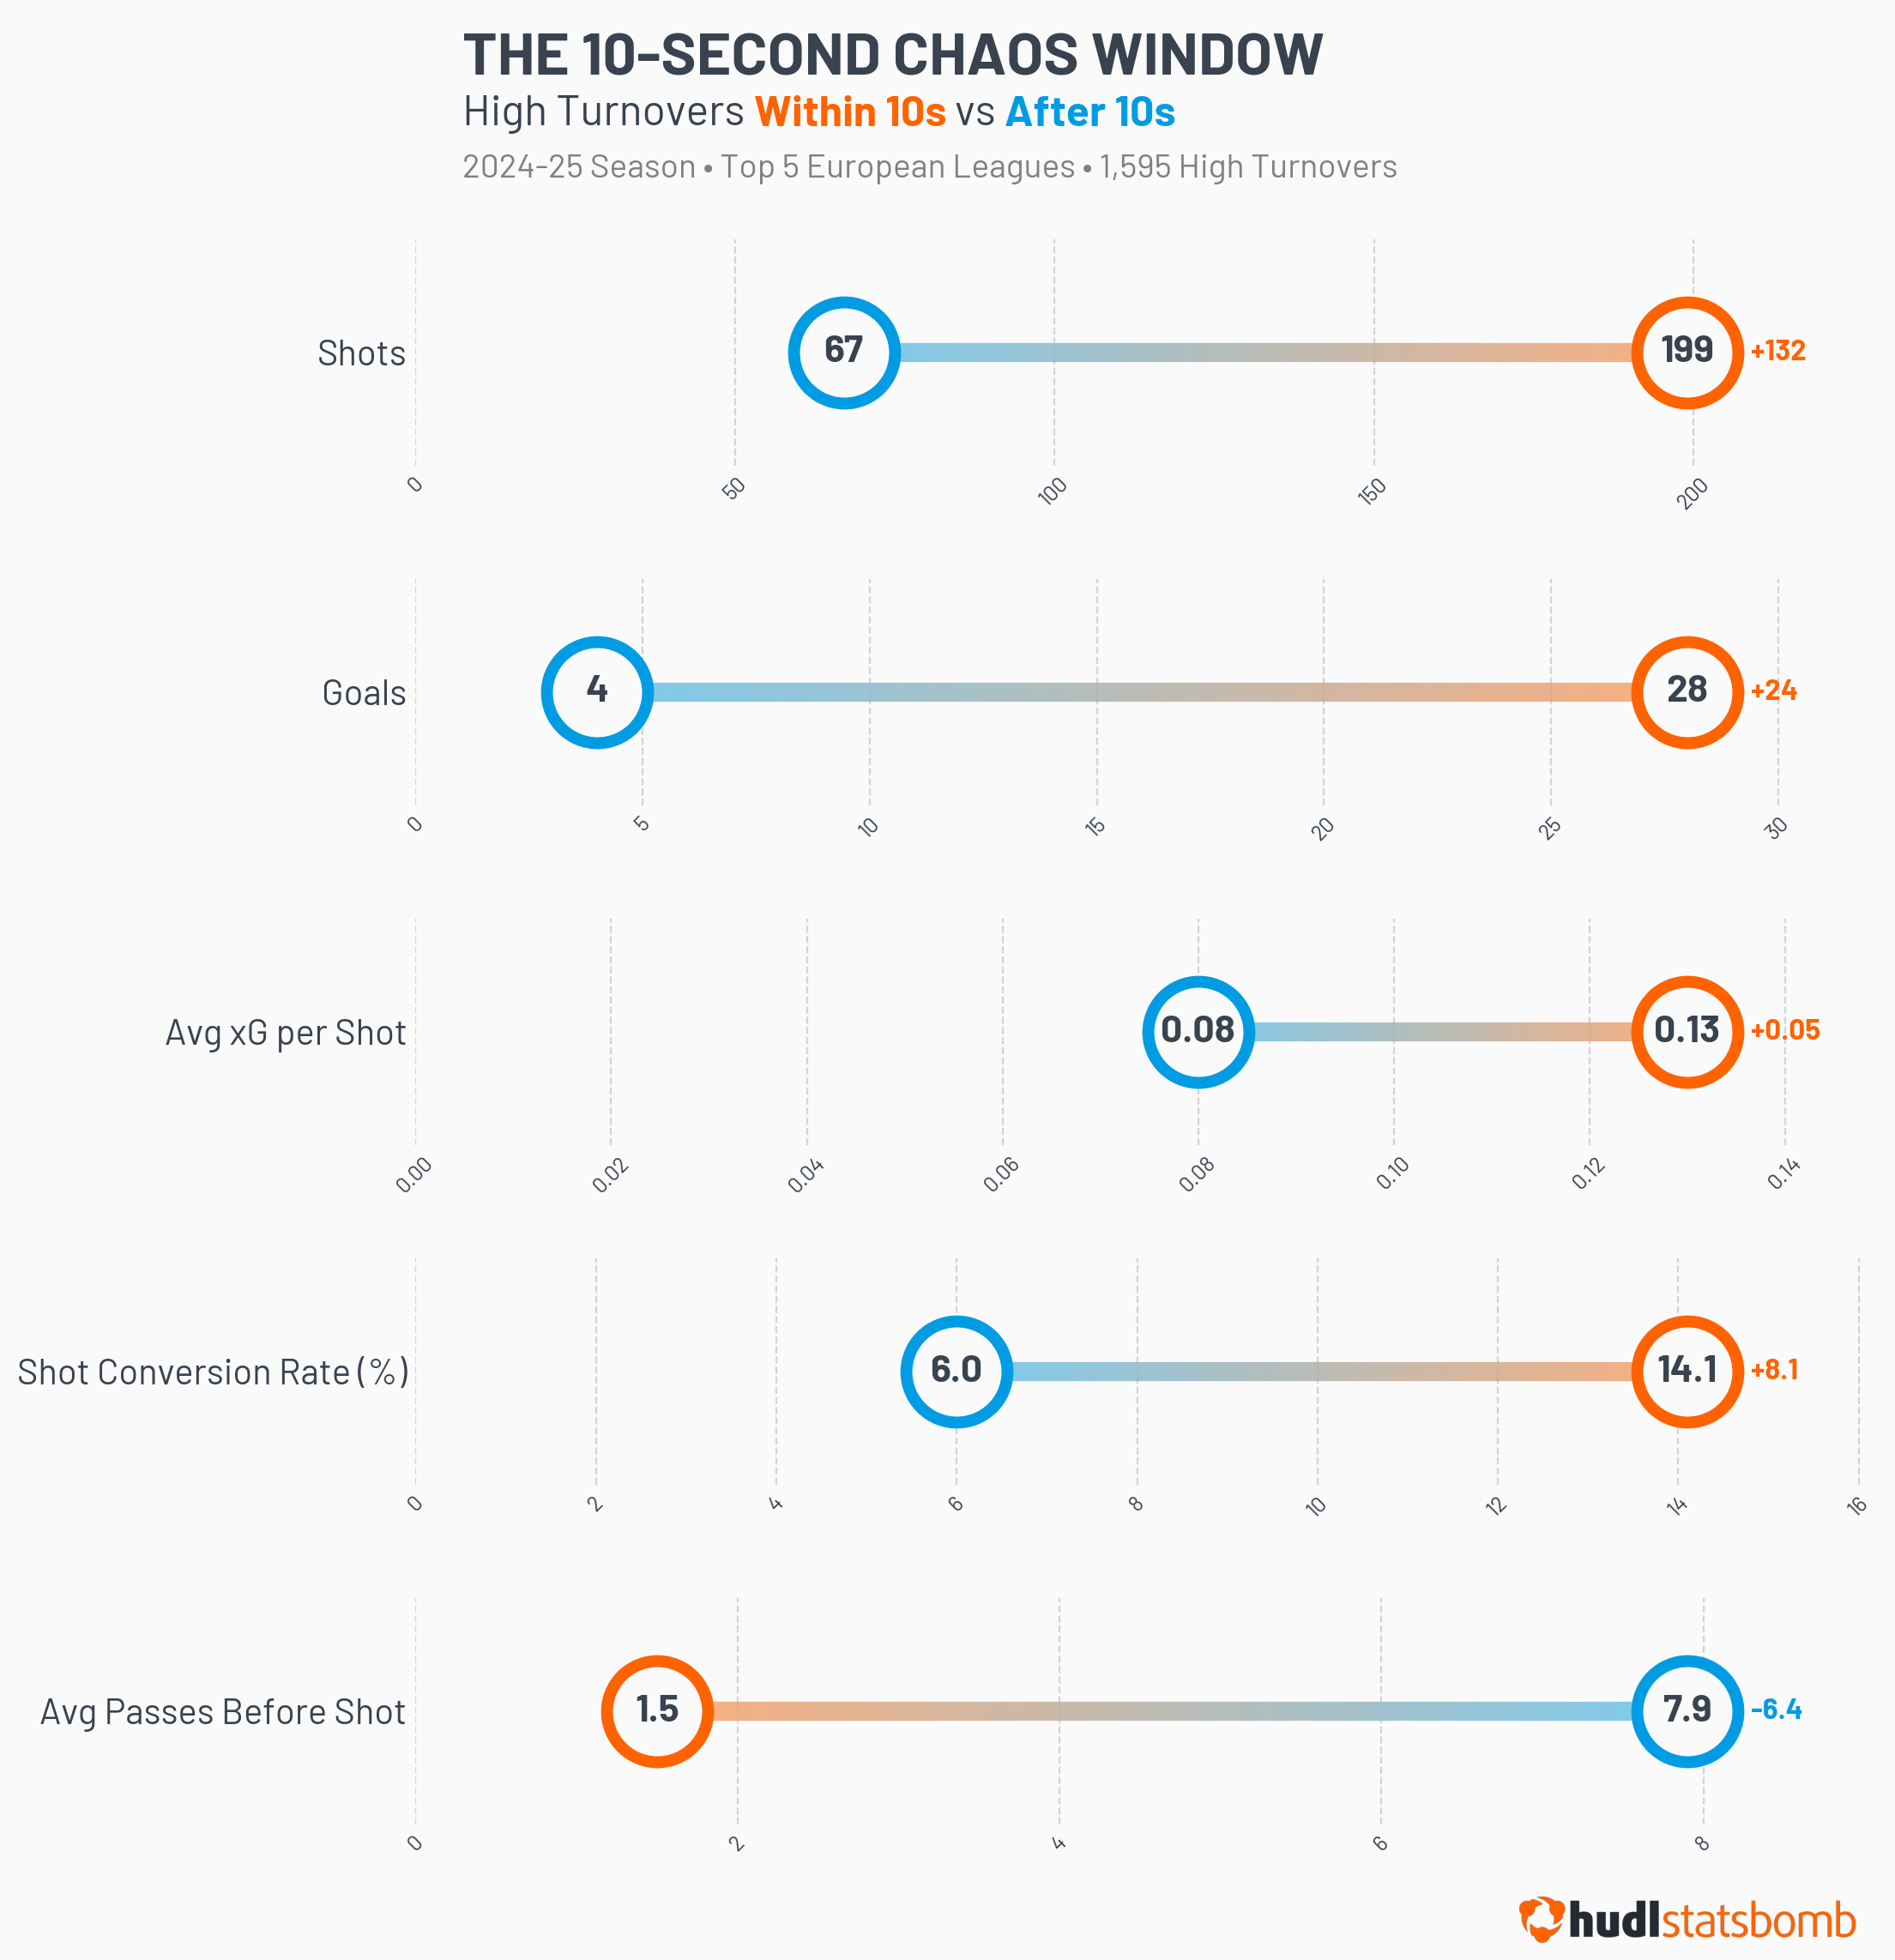
Last season across Europe's top five leagues, teams that won possession within 40 metres of goal produced a shot within ten seconds 12.5% of the time. Teams in sustained possession managed that just 5.2% of the time. High turnovers produced goals at roughly 2.5 times the rate of normal possession attacks – defenders disorganised, passing lanes open, the goalkeeper not yet set.
The danger doesn't linger. After ten seconds, shot quality collapses by 38% and conversion rates drop by nearly 60%.
When a team wins the ball high, the next ten seconds contain more goal threat than the next ten minutes.
The Compounding Effect of Progressive Passes
Winning the ball in dangerous areas is one way to create a threat. Another is to build it – advancing directly through the opposition.
A progressive pass is one that moves the ball at least 25% closer to the opponent's goal. Not a hopeful ball pumped forward, but a deliberate attempt to shift the defensive block, advance position, and force a response.
Across this season and last in Europe's Big Five leagues, a possession with no progressive passes produces a shot just 5.8% of the time. Add one and it jumps to 17.6%. Two and it's 36.1%. If there's a third, you're looking at 47.6% – with average xG per possession at 0.077 compared to 0.005 with none. Fifteen times the chance quality, across just three passes. Each one leaves the defence slightly more exposed than the last – and by the third, the gap is usually there.
Liverpool's title-winning season last year was built in part on this. In possessions where they played two or more progressive passes and ended in a shot, their average xG was 0.374 – against a season average of 0.116. Twenty-two of their 86 league goals came from these sequences. Not just more chances – better ones, by a factor of three.
Barcelona tell the same story at the top of La Liga this season. In shot-ending possessions with two or more progressive passes, they're generating 0.198 xG per shot against a league average of 0.121. At the time of writing, eighteen of their 77 league goals came from these sequences.
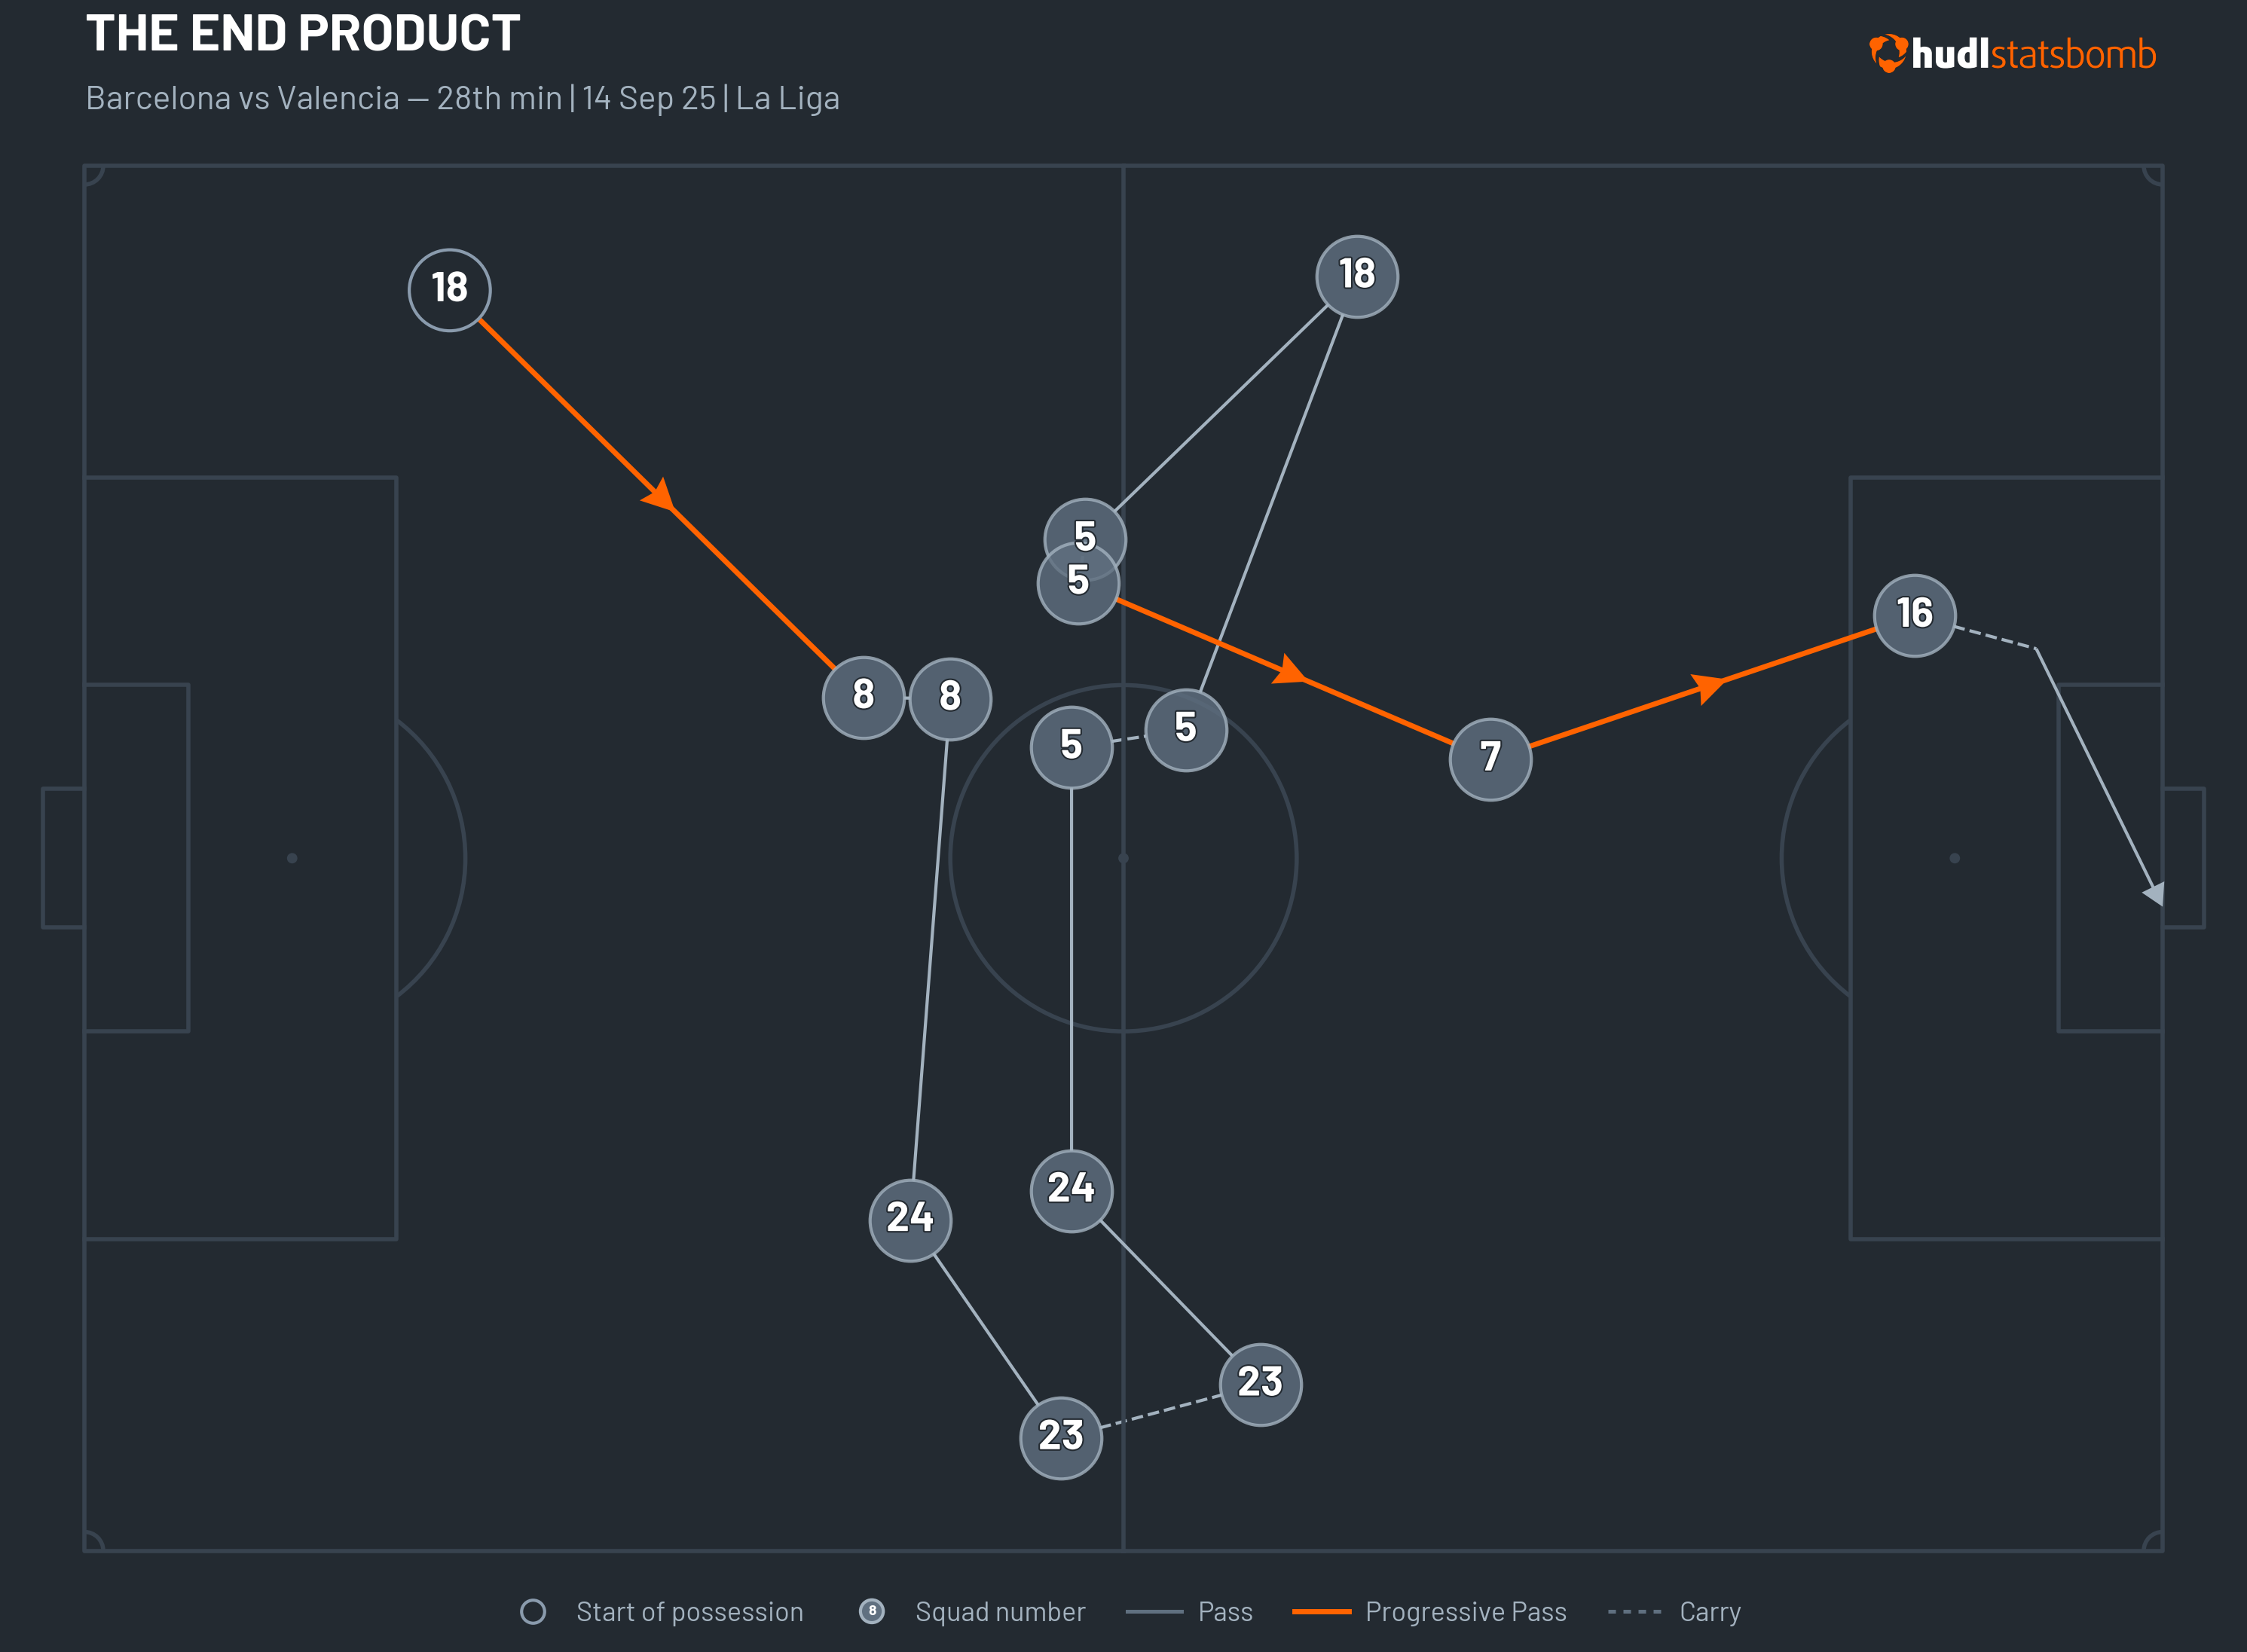
The sequence in the visual above takes 27 seconds and nine passes – three of them progressive. By the time Cubarsí plays it to Ferrán Torres in the final third, the defensive block has been pulled apart.
Goals have a habit of being taken at face value, though. A 3–1 win looks like dominance. A 1–0 loss looks like failure. The scoreline becomes the story – and the story is often wrong.
The Second Goal
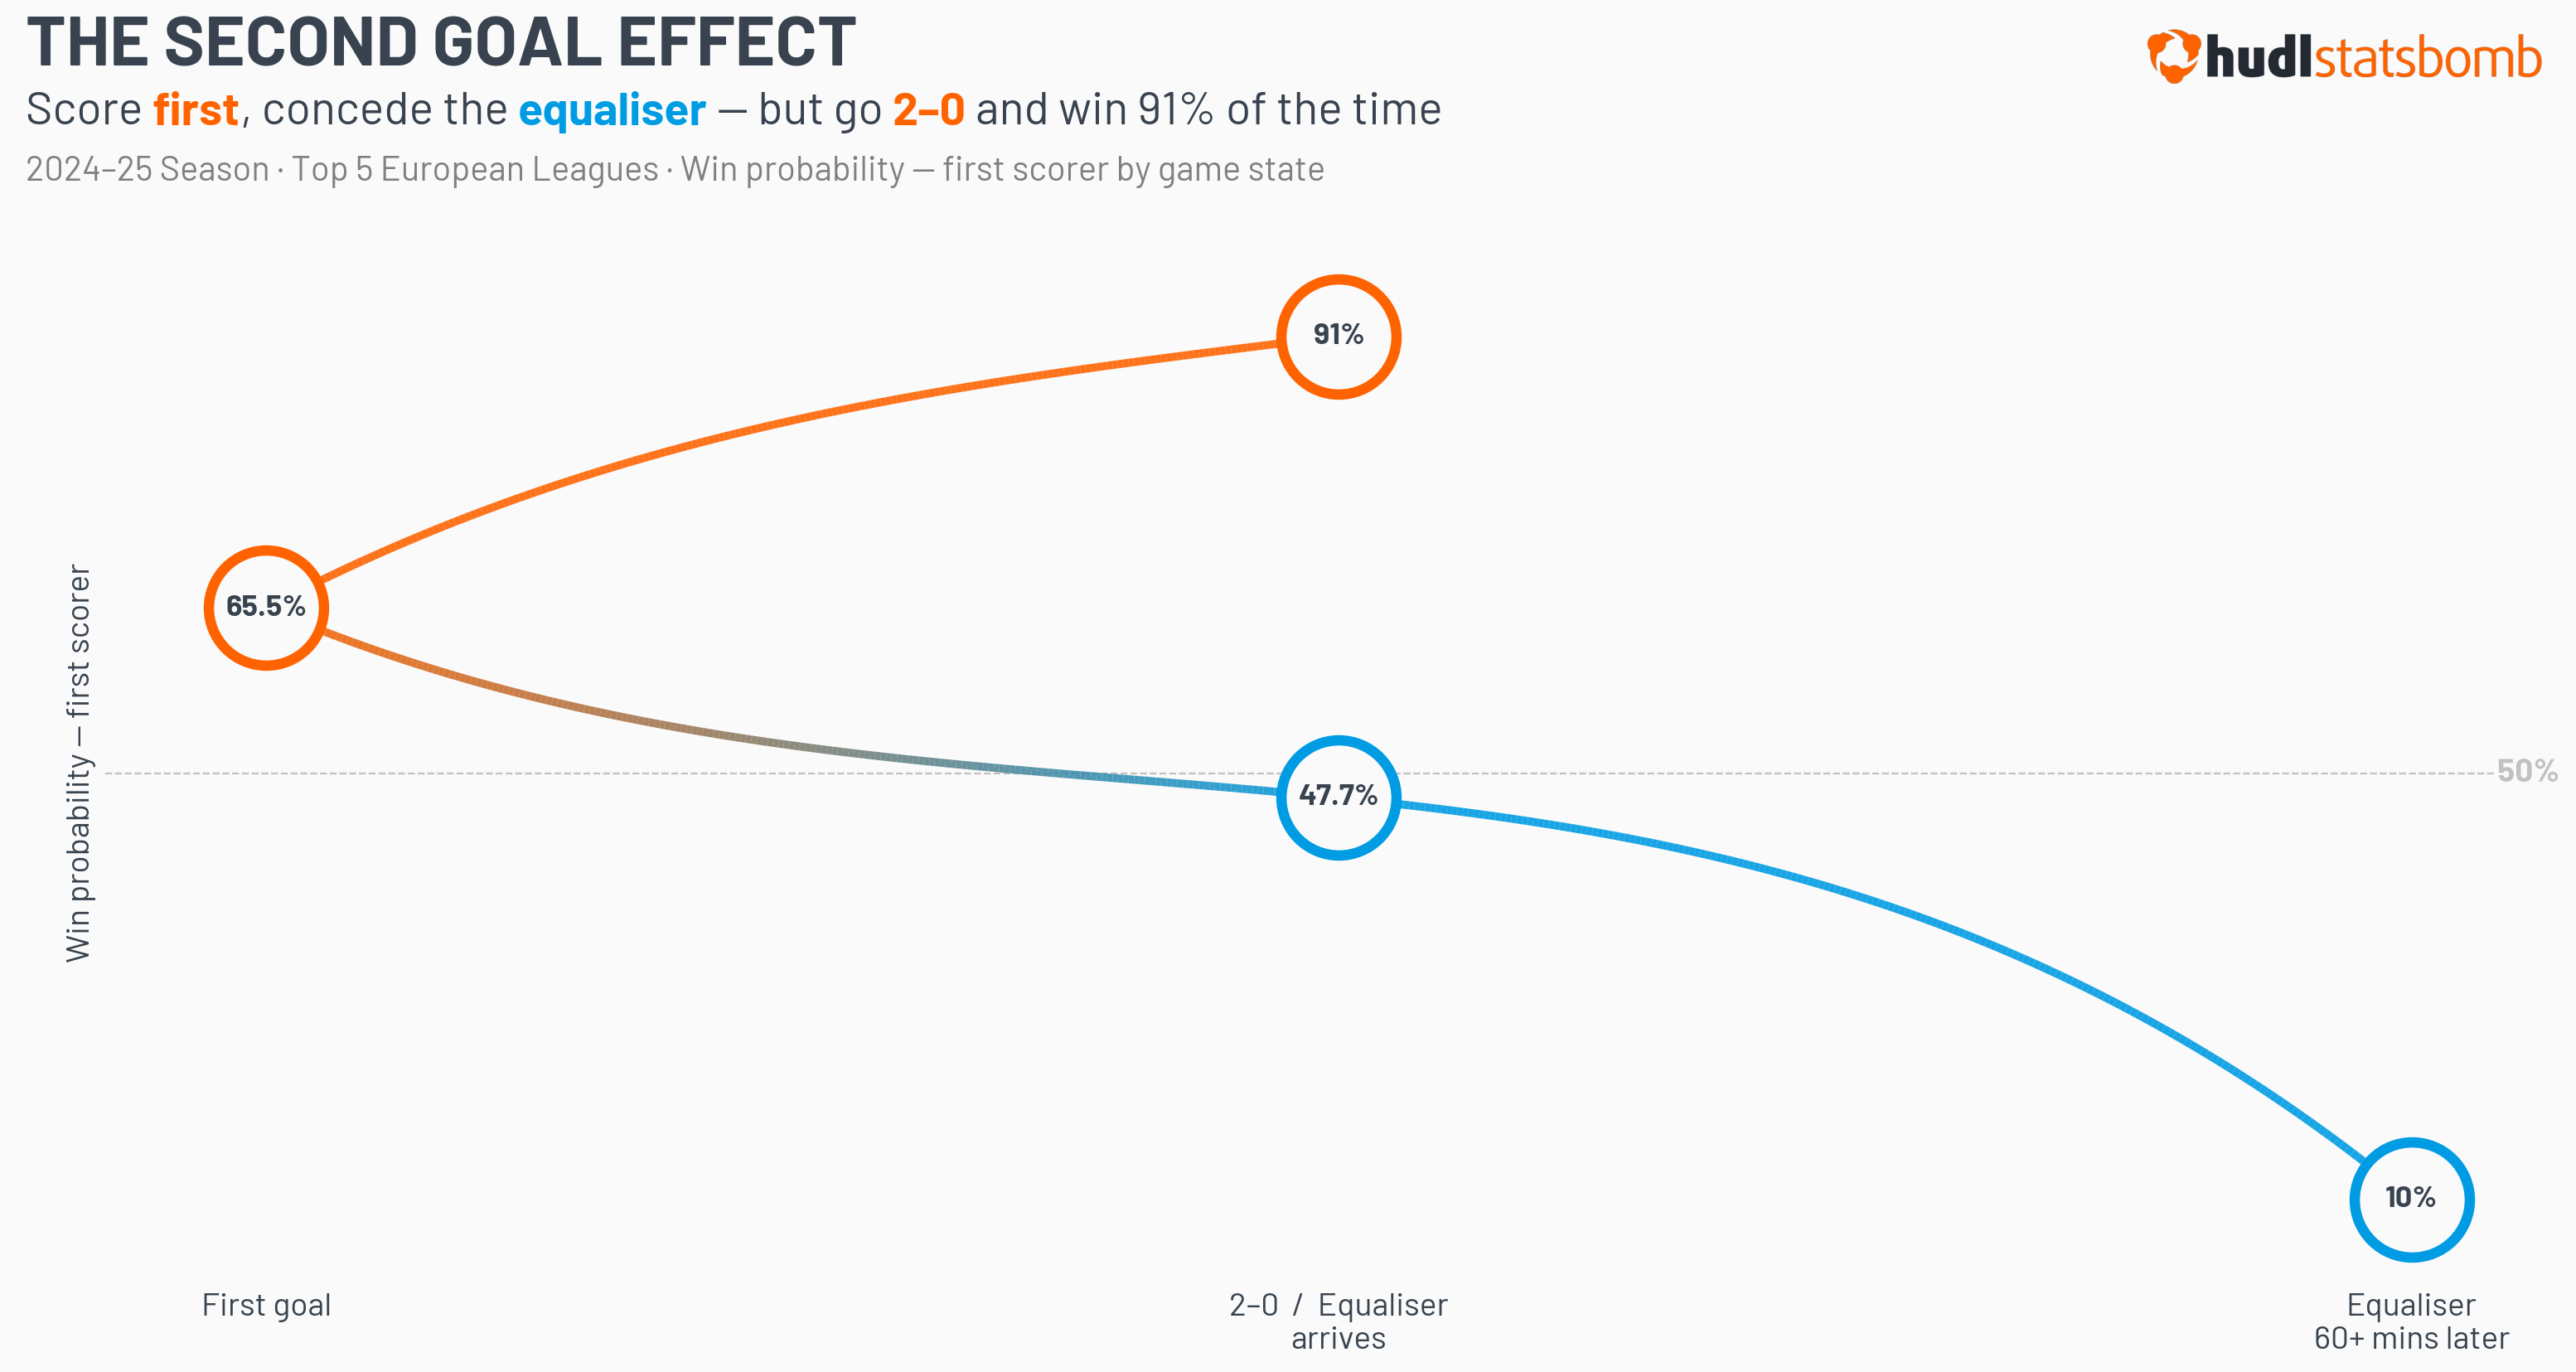
Score first, win 65% of the time – that's the record across Europe's top five leagues last season. That sounds decisive. It isn't.
In 58.8% of matches where a first goal is scored, the next one goes to the other team – typically around 25 minutes later. The team that's behind pushes on, the game opens up, spaces appear. When the equaliser lands, the first scorer's win probability is down to 47.7%. Barely a coin flip – and not much of a signal on its own.
But cut the data a different way and something sharper comes through. When the equaliser comes more than 60 minutes after the opener, the first scorer wins just 10% of the time. Every one of those matches had the opening goal inside 30 minutes.
Picture what those games look like. A team goes ahead early and never pushes on – the manager tucks the shape and they defend. For an hour it works. By the 75th minute the shape that looked so organised in the first half is held together by willpower and tired legs. When the equaliser comes, one side is celebrating. The other has been hanging on for an hour and has nothing left to give. Ninety percent of the time, the team that led for most of the match doesn't win it.
Teams that go 2–0 win 91% of the time – 25th minute or 75th, it barely changes. A second goal doesn't just extend the lead. It ends the conversation.
When the Scoreline Lies
Some signals decide the match already being played. This one shapes the next five. xG and goals don't always tell the same story, but over a full season the gap almost always closes. What matters is when a team's finishing breaks sharply from its own baseline – not just from the league average, but from what that team normally is.
Every team has a baseline. Elite attacks might consistently finish slightly above expectation, weaker ones slightly below. When that gap widens sharply over a short run, it doesn't last.
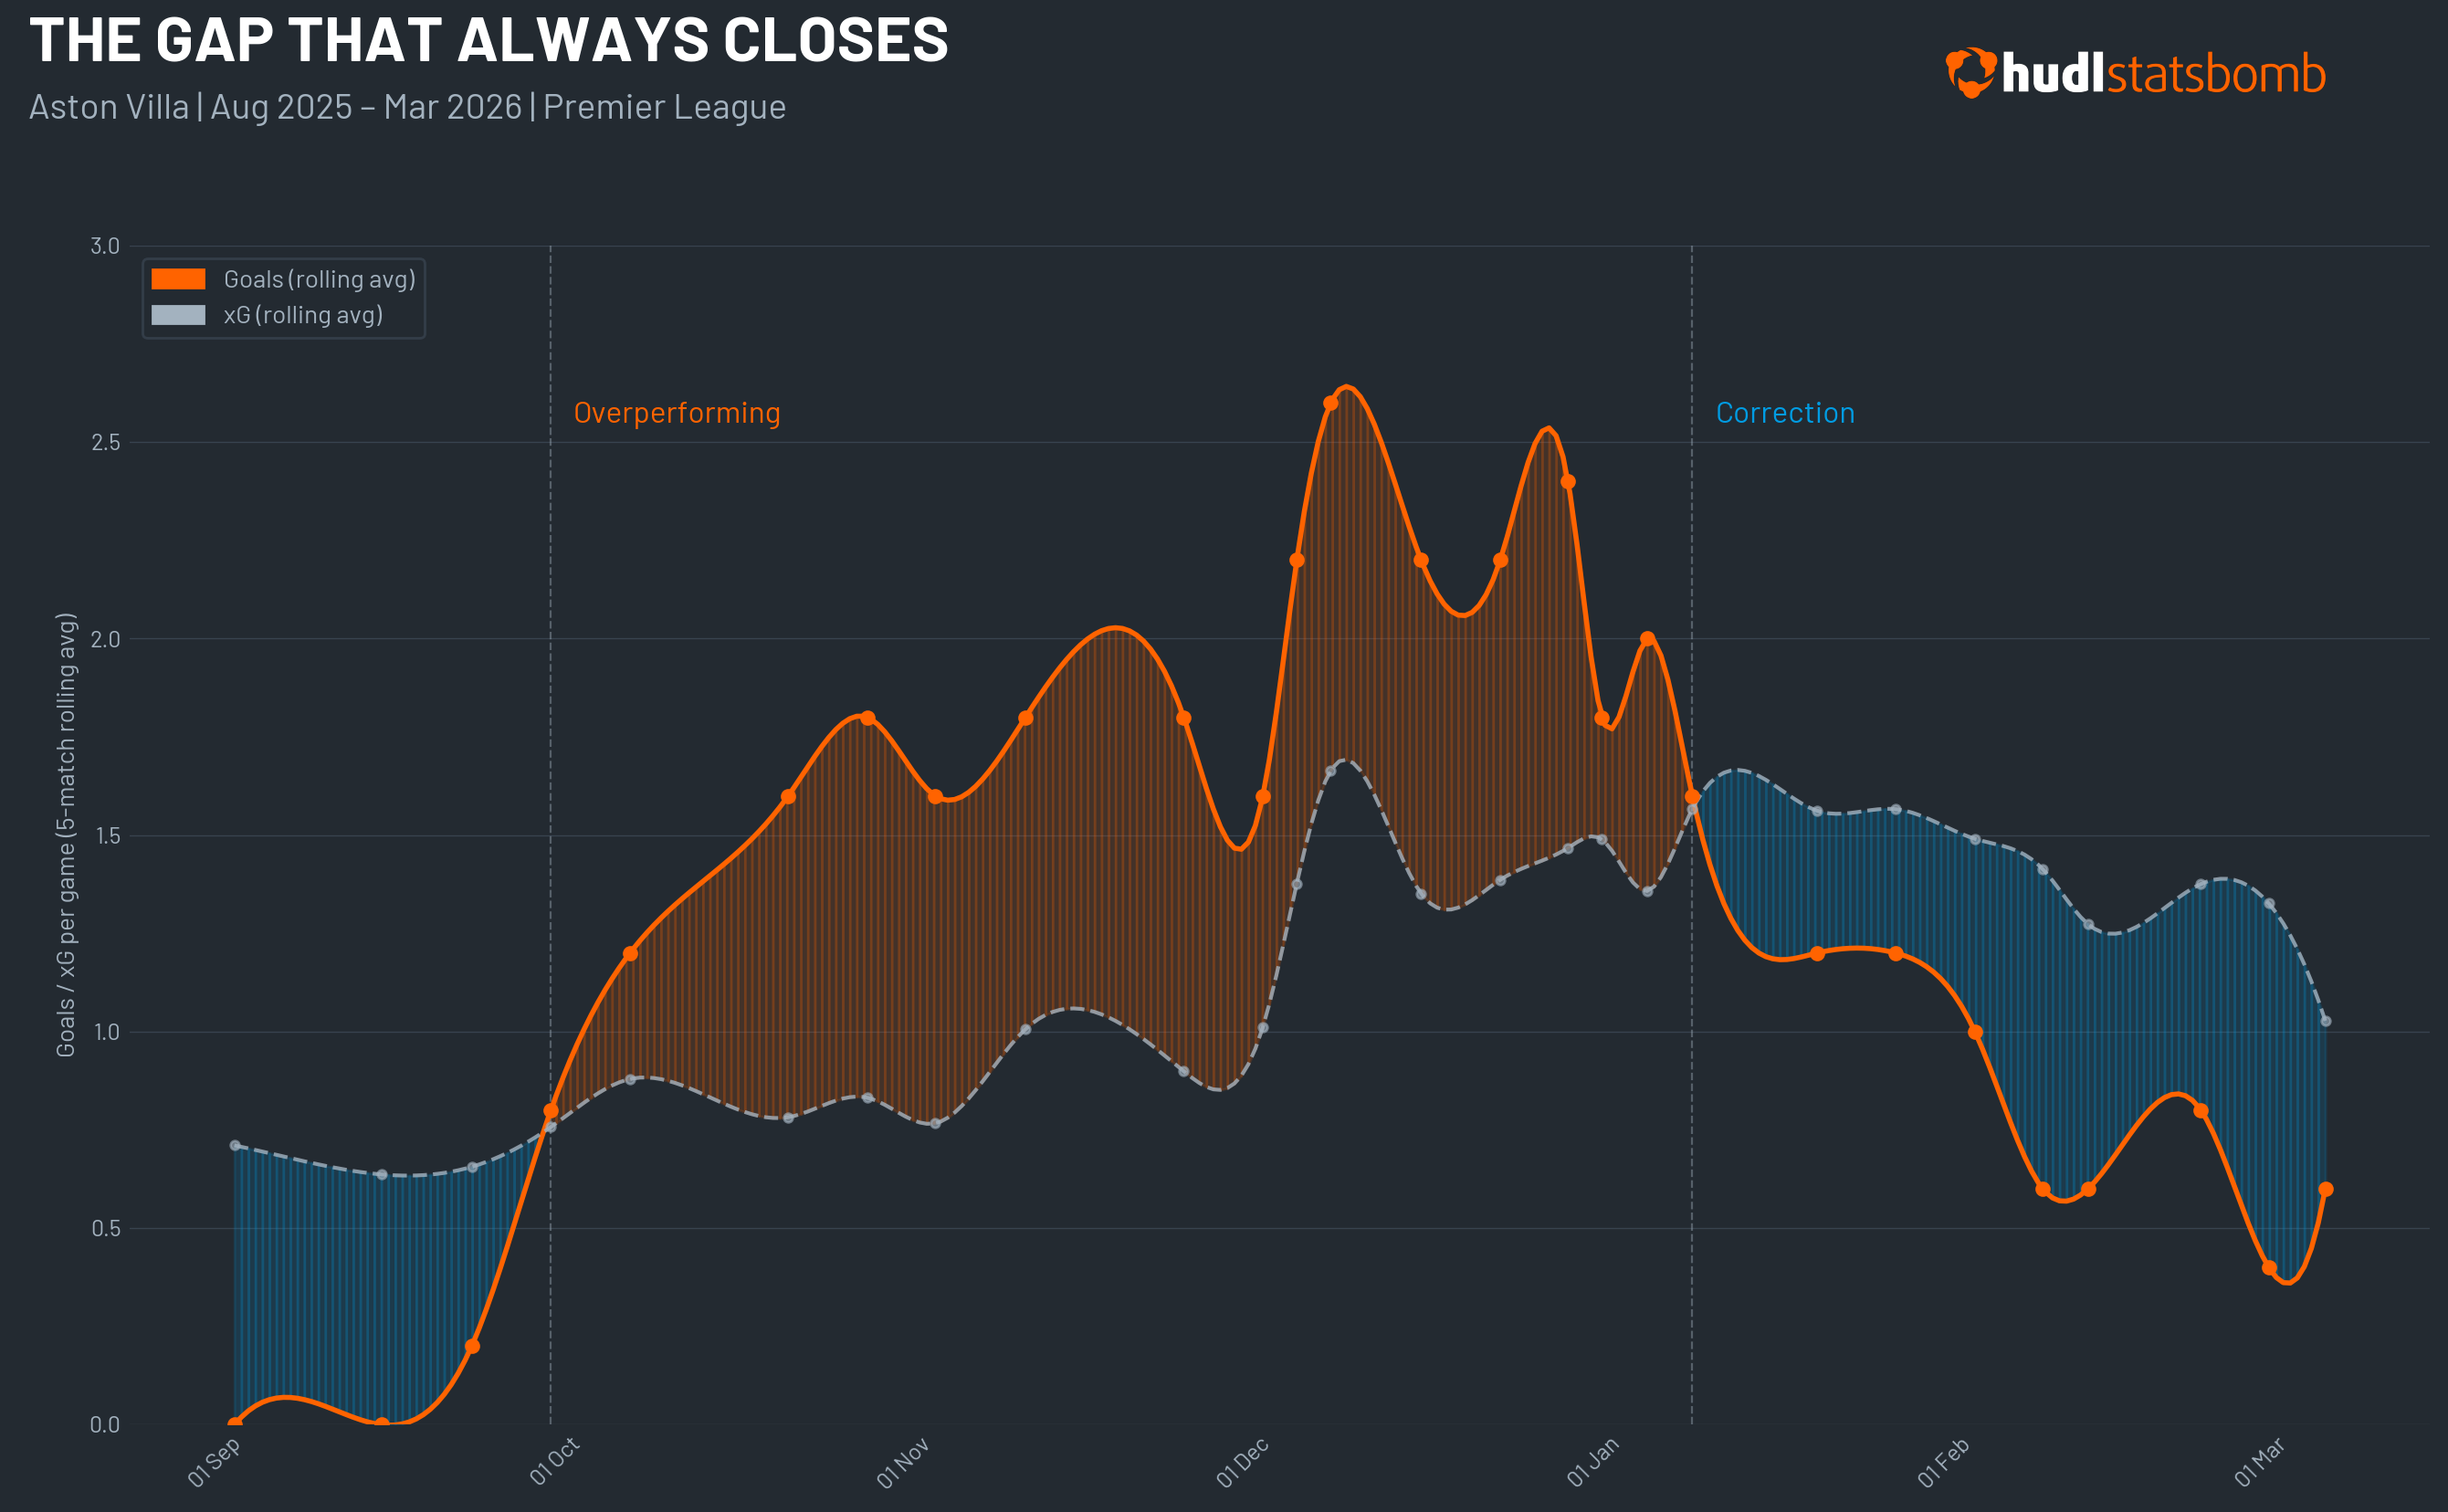
Aston Villa made the point this season. Between late September and late December they averaged 2.1 goals per game from an underlying xG of just 1.17 – a +0.74 divergence across thirteen matches. Villa rank among the league's leaders for shots from outside the box – 37% of all their attempts. Spectacular goals, but not sustainable ones. A gap that wide doesn't persist.
Since late December, they've averaged 0.6 goals per game from a higher underlying xG of 1.25. The underlying process hasn't changed – if anything it's improved. The finishing has returned to where it normally sits.
The data won't tell you the exact match when the correction arrives. But when finishing drifts that far from a team's usual level, it always does.
From Patterns to Predictions
Each signal operates on a different timescale. The high turnover gives you ten seconds. The progressive sequence gives you the next possession. The second goal gives you the match itself. The xG divergence gives you the next five matches.
They're pointing at the same thing from different distances. When chaos is about to be exploited. When a defensive structure is about to break. When a match has just flipped. When a results run has gone further than the football warranted.
These are examples – a fraction of what's available with live event data. There are predictive signals across every timescale of the game, in phases and sequences this piece hasn't touched.
None of them guarantee a goal. But they change the question from "what happened?" to "what's building?" – and in a game decided by margins, that question is worth more than most people think.
Want to find out more about our live data solutions?