EuroLeague by the Numbers: A Hudl Instat Analysis
The EuroLeague 2025/26 Regular Season produced some of the most compelling individual and team performances in recent memory. In the lead up to the next EuroLeague tip off, let’s recap the stories of last season’s best performers through the lens of advanced data.
Using the same statistics sourced through Hudl Instat and FastScout that professional clubs around the world use, we break down the underlying numbers behind the top players who claimed last season's biggest honours.
*All statistics sourced via Hudl Instat, powered by Instat Basketball and Fast Scout. Minimum sample thresholds applied throughout: 200+ points scored for individual shooting metrics.
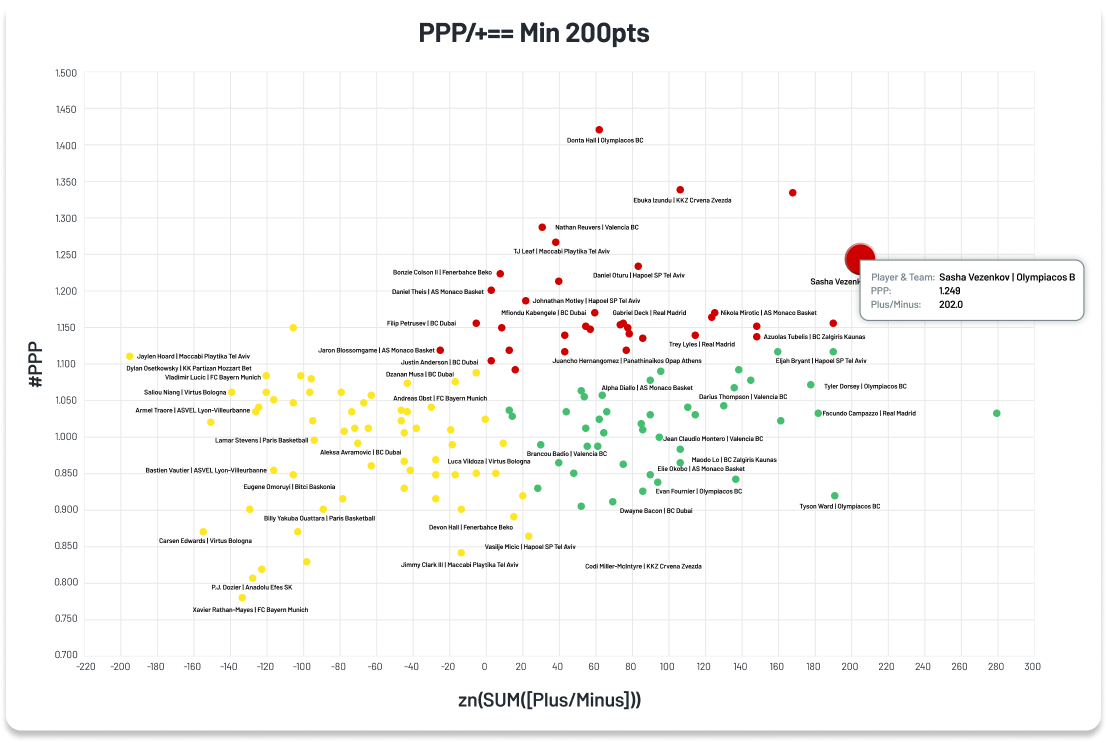
Points Per Possession vs. Plus/Minus
Hudl Instat's PPP (Points Per Possession) metric adds another dimension. When clustered across the full roster of regular-season contributors, three distinct groups emerge.
Yellow: low plus/minus and low PPP - Low scoring efficiency relative to possession usage combined with negative team point differentials.
Green: high plus/minus and low PPP - High team impact despite lower individual scoring efficiency.
Red: high plus/minus and high PPP - High individual scoring efficiency paired with positive team impact.
Vezenkov anchors the elite cluster - the red dots in our analysis below - combining elite PPP with a standout plus/minus rating. In other words, his team doesn't just score more when he shoots; they win more when he plays.
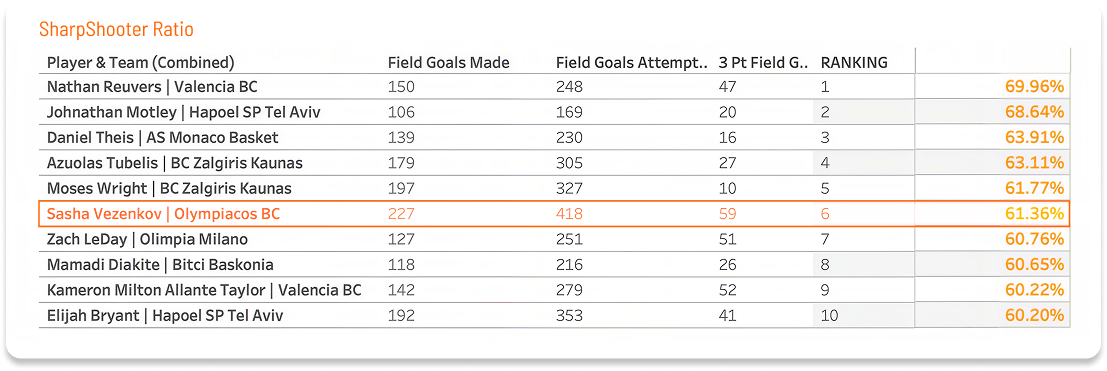
Sharp Shooter Ratio & Volume Leadership
The Sharp Shooter Ratio - a composite metric from Hudl Instat - combining field goals made, field goals attempted, and three-pointers made — ranks Vezenkov 6th in the league. But here's the context that makes that number extraordinary: he achieved that ranking while carrying the highest volume of attempts in the entire competition. Efficiency at elite volume is the hardest thing to sustain in basketball. Vezenkov did it all season.
True Shooting % — Top 10 in the League
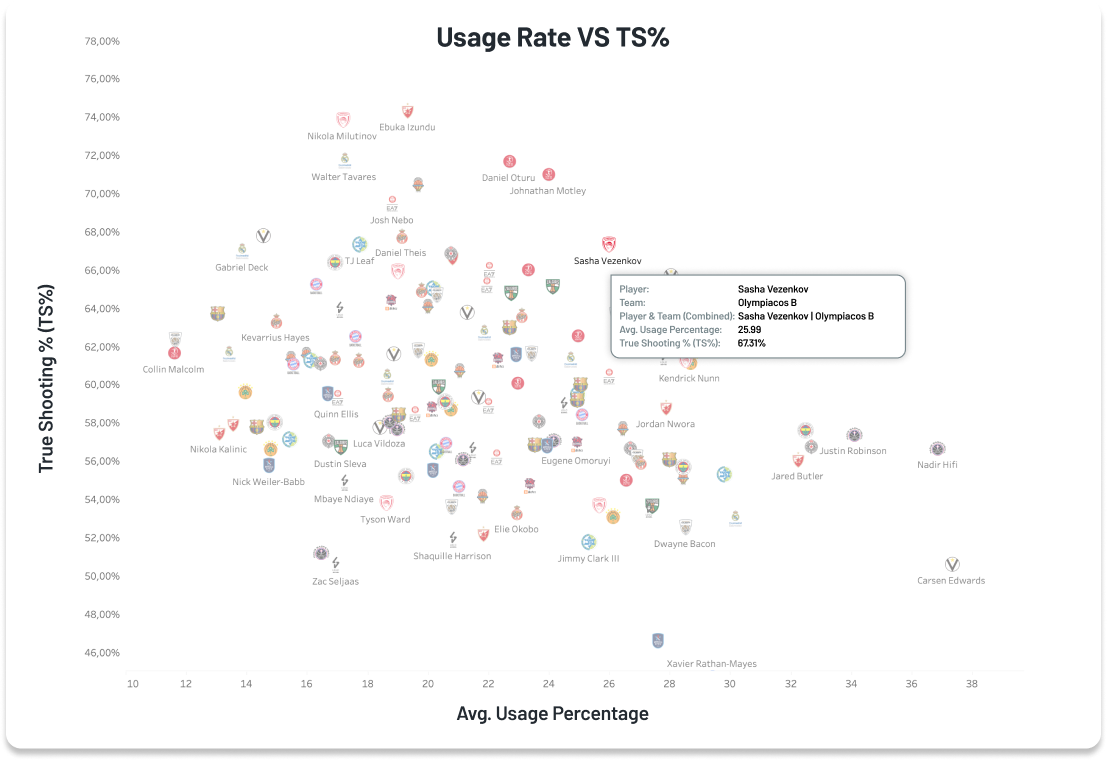
Among all players who scored at least 200 points during the regular season, Vezenkov's TS% placed him in the top 10. That threshold matters - it filters out low-minute, low-sample outliers and leaves only the players who faced sustained defensive attention night after night. Vezenkov's efficiency held up regardless.
Jean Montero: The Rising Star That Our Data Saw Coming
Valencia's Jean Montero didn't just have a breakout season - he had a historically efficient one for a player his age, and the Hudl Instat data shows exactly why.
King of the Paint
Montero ranked in the top 10 in the league for points scored in the paint (minimum 200 paint points), and crucially, his paint efficiency percentage - the rate at which his attempts inside converted - was elite. This is a rare combination. Many young guards rely on perimeter shooting to pad their numbers; Montero attacked the basket with the conviction of a seasoned finisher.
Paint dominance at his age signals something important: it suggests he's not dependent on catch-and-shoot opportunities or defensive breakdowns. He's creating and converting in the game's most contested zone.
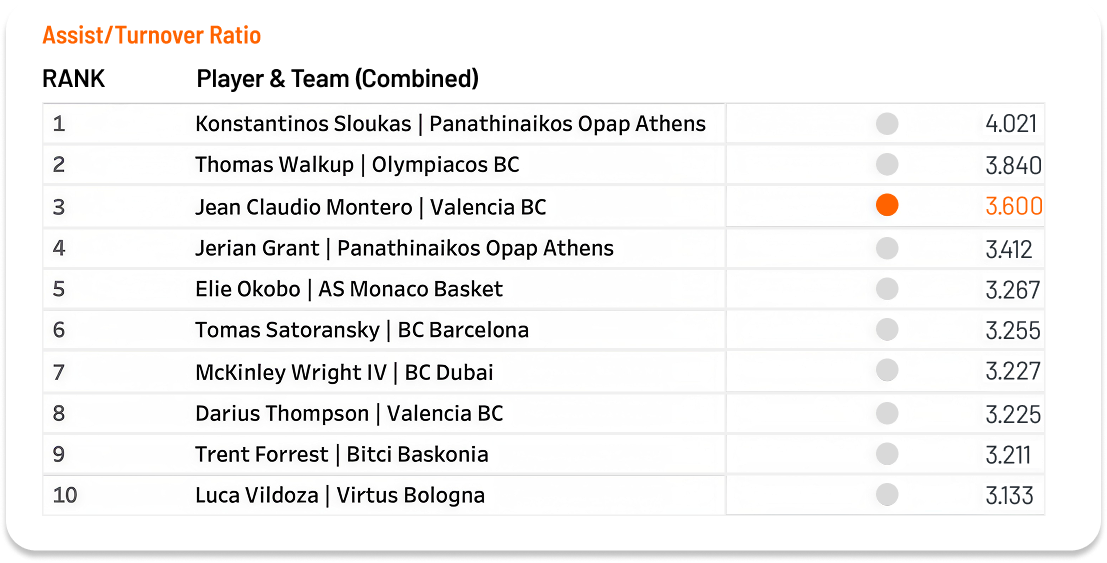
Assist-to-Turnover Ratio — The Playmaking Test
The Assist-to-Turnover Ratio (AST/TO) is one of basketball's most honest metrics, particularly for guards. It strips away the aesthetic qualities of playmaking and asks a simple question: does your creation generate more value than it costs? The higher the ratio, the more a player gives to teammates without giving the ball away.
Montero's numbers here mark him as a genuine point guard talent, not just a scorer using point guard positioning. That two-way playmaking quality - creating for others while also dominating in the paint - is exactly what Valencia needed, and exactly what the data captured throughout the season.
Offensive & Defensive Rating — A Complete Player
Hudl Instat tracks Offensive Rating (ORtg) — points produced per 100 possessions — and Defensive Rating (DRtg) — points allowed per 100 possessions — for every player with sufficient minutes. The ideal profile is simple: high ORtg, low DRtg.
Montero's profile across both metrics placed him among the most complete young players in European basketball this season. The EuroLeague Rising Star award is often viewed through an offensive lens alone. The defensive rating data tells a fuller story — and a more impressive one.
A Pedro Martinez Masterclass: What the Numbers Reveal About Valencia BC’s Rise
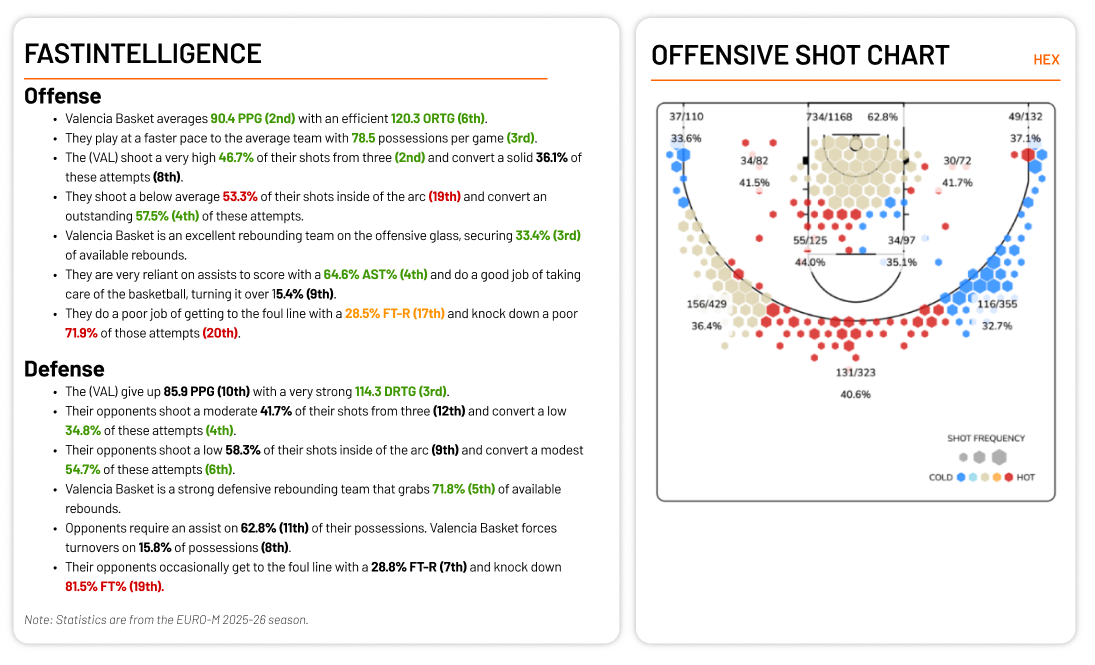
Pedro Martinez's Coach of the Year award reflects something that individual player statistics can only hint at: the construction of a system where collective performance consistently outperforms the sum of its parts.
Valencia made history this season, by making it to the Euroleague Final Four for the very first time. Rubbing shoulders with traditional giants Real Madrid, Olympiacos, and Fenerbahçe Beko.
Using FastScout’s team-level metrics for Valencia BC reveals a side that maintained exceptional offensive and defensive ratings across the regular season — not just in individual games, but as a sustained trend. That consistency is a coaching fingerprint.
Martinez built Valencia around:
- Disciplined ball movement: Reflected in the team's assist-to-turnover numbers, which echoed Montero's individual excellence at scale.
- Paint dominance: Montero's interior numbers weren't an individual outlier; they were a systemic preference of Valencia’s style of play.
- Defensive cohesion: Team DRtg held steady even as opponents game-planned specifically to attack Valencia's structure.
Why Advanced Stats Change What We See in the EuroLeague
The traditional box score — points, rebounds, assists — captures what happened. Advanced metrics explain why it happened and what it means.
Without USG% and TS% in combination, Vezenkov looks like a good scorer. With them, he looks like the most efficient high-volume scorer in the competition. Without paint efficiency data, Montero's paint numbers are just a counting stat. With them, you see a finishing skill set that should scare every European defence for the next decade.
Hudl Instat and FastScout surface these relationships — usage vs. efficiency, creation vs. protection, individual rating vs. team context — in ways that allow coaches, scouts, analysts, and fans to see the game more clearly.
The 2025/26 EuroLeague season had remarkable stories. The data, as it always does, made them legible.