The Reporter's Guide to Football Event Data

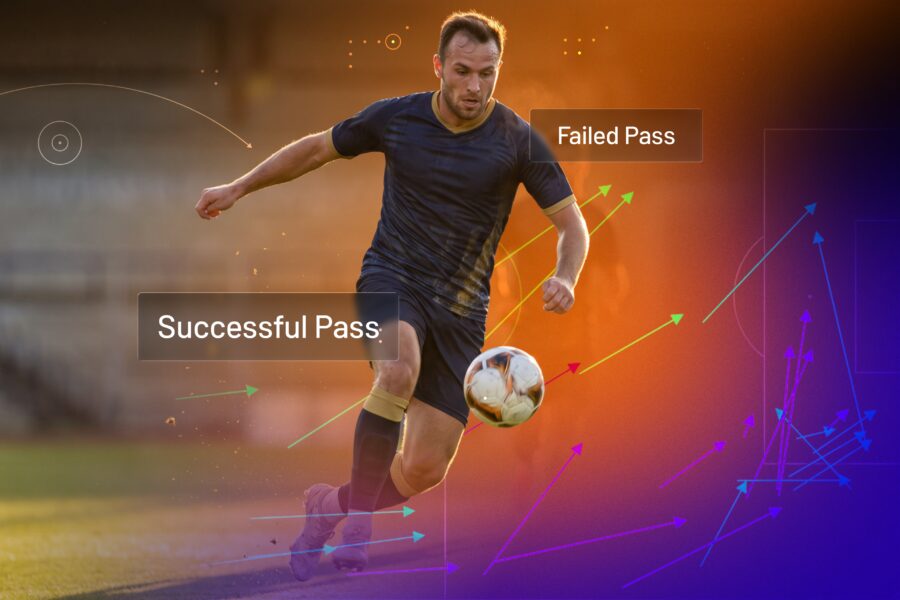
You don’t need to be a data scientist to use Hudl’s football event data. Here’s how to put our data to work in your next match report.
What Is Event Data, and Why Does It Change the Story?
Every pass, carry, tackle, duel, shot - each one is a data point. A single match generates thousands of data points. Hudl Statsbomb’s event data captures all of it, across more than 200 competitions worldwide.
Traditional broadcast statistics tell you what happened at the margins: who scored, who assisted, who kept the clean sheet. Event data fills in the context of everything that happened in between. The pass that broke the defensive line. The press that forced the turnover. The forward who toiled ambitiously all night and ended up with nothing to show for it — and why.
The difference matters for reporters because the most insightful and unique stories exist almost always in the in-between.
That's where the best football stories live.
On-Ball Value (OBV)
The midfielder completed 71% of his passes. Routine. Anonymous. Nothing in the stat line to write about. But pass completion only tells you how often the ball reached a teammate. It says nothing about whether that teammate was in a dangerous position, or whether the pass moved the team anywhere useful at all.
A midfielder can complete 90% of his passes going sideways and finish the game having contributed almost nothing.
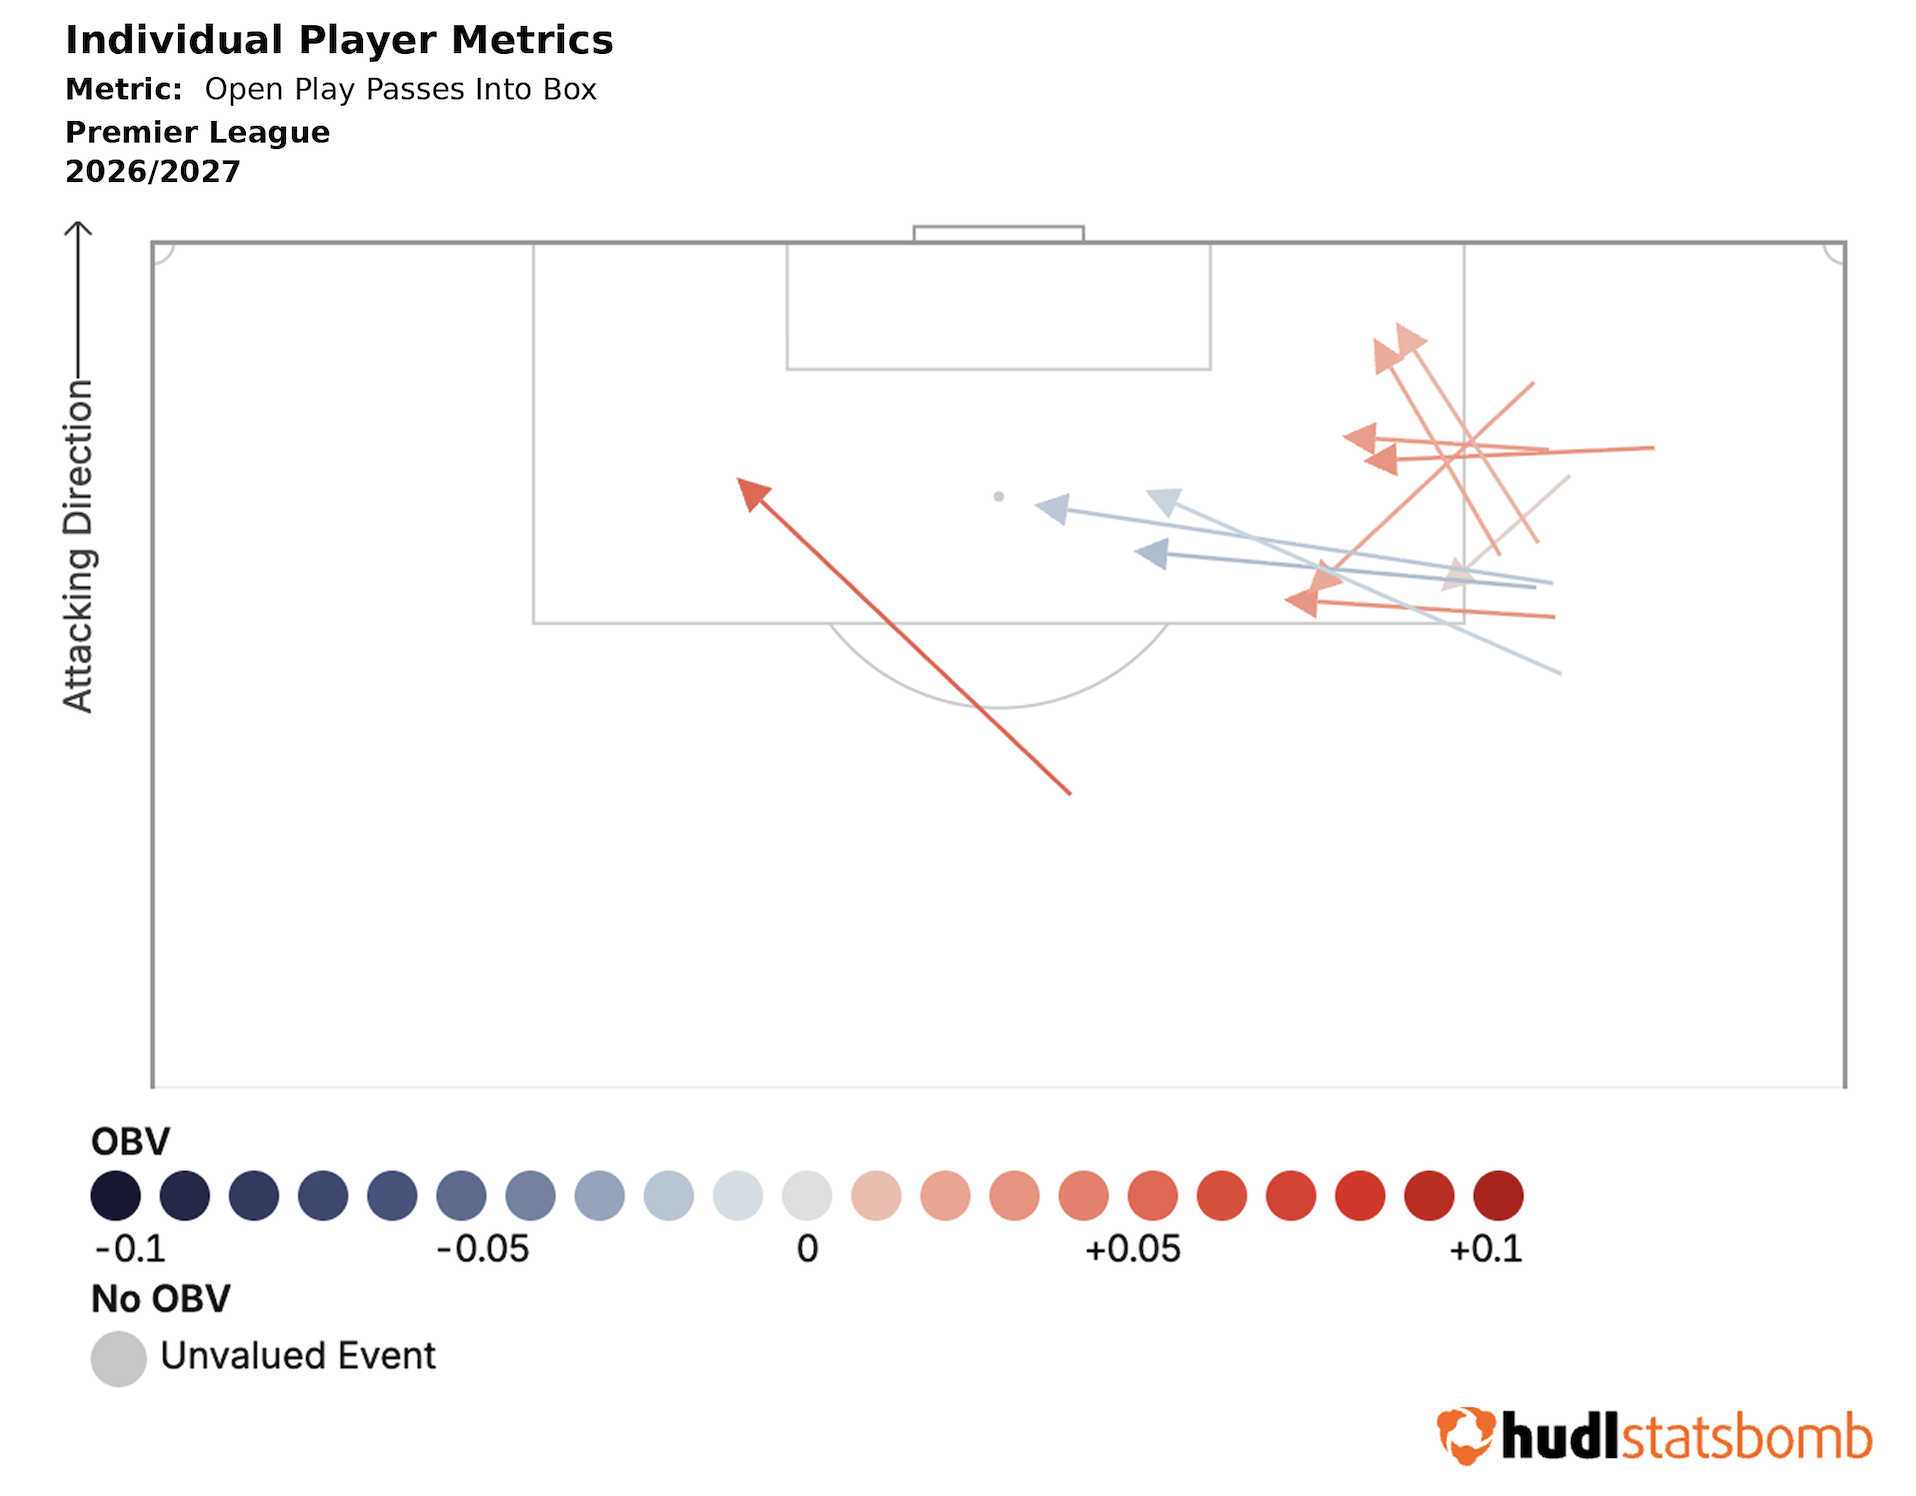
OBV assigns a value to every on-ball action - pass, carry, dribble, pressure - based on how much it shifts the probability of scoring or conceding. OBV tells you whether that 90% pass completion rate actually meant anything.
Putting OBV to work: In the group stage of a major tournament, it's common to see a holding midfielder finish with a 94% pass completion rate and get a 7/10 in the ratings.
OBV will often tell a different story: if the vast majority of those passes went sideways or backwards, the OBV from carrying and passing can be flat or negative. Meanwhile, the midfielder who completed 78% but consistently played into the final third - breaking lines, changing the angle of attack - shows strongly positive OBV. The completion percentages put them in the same bracket. OBV separates them immediately.
The journalist's angle: OBV is particularly powerful in transfer windows. When a club buys a deep-lying midfielder and the initial reaction is "he never scores or assists," OBV is how you explain what a club is actually paying for - or to expose what they're not getting.
Pressures
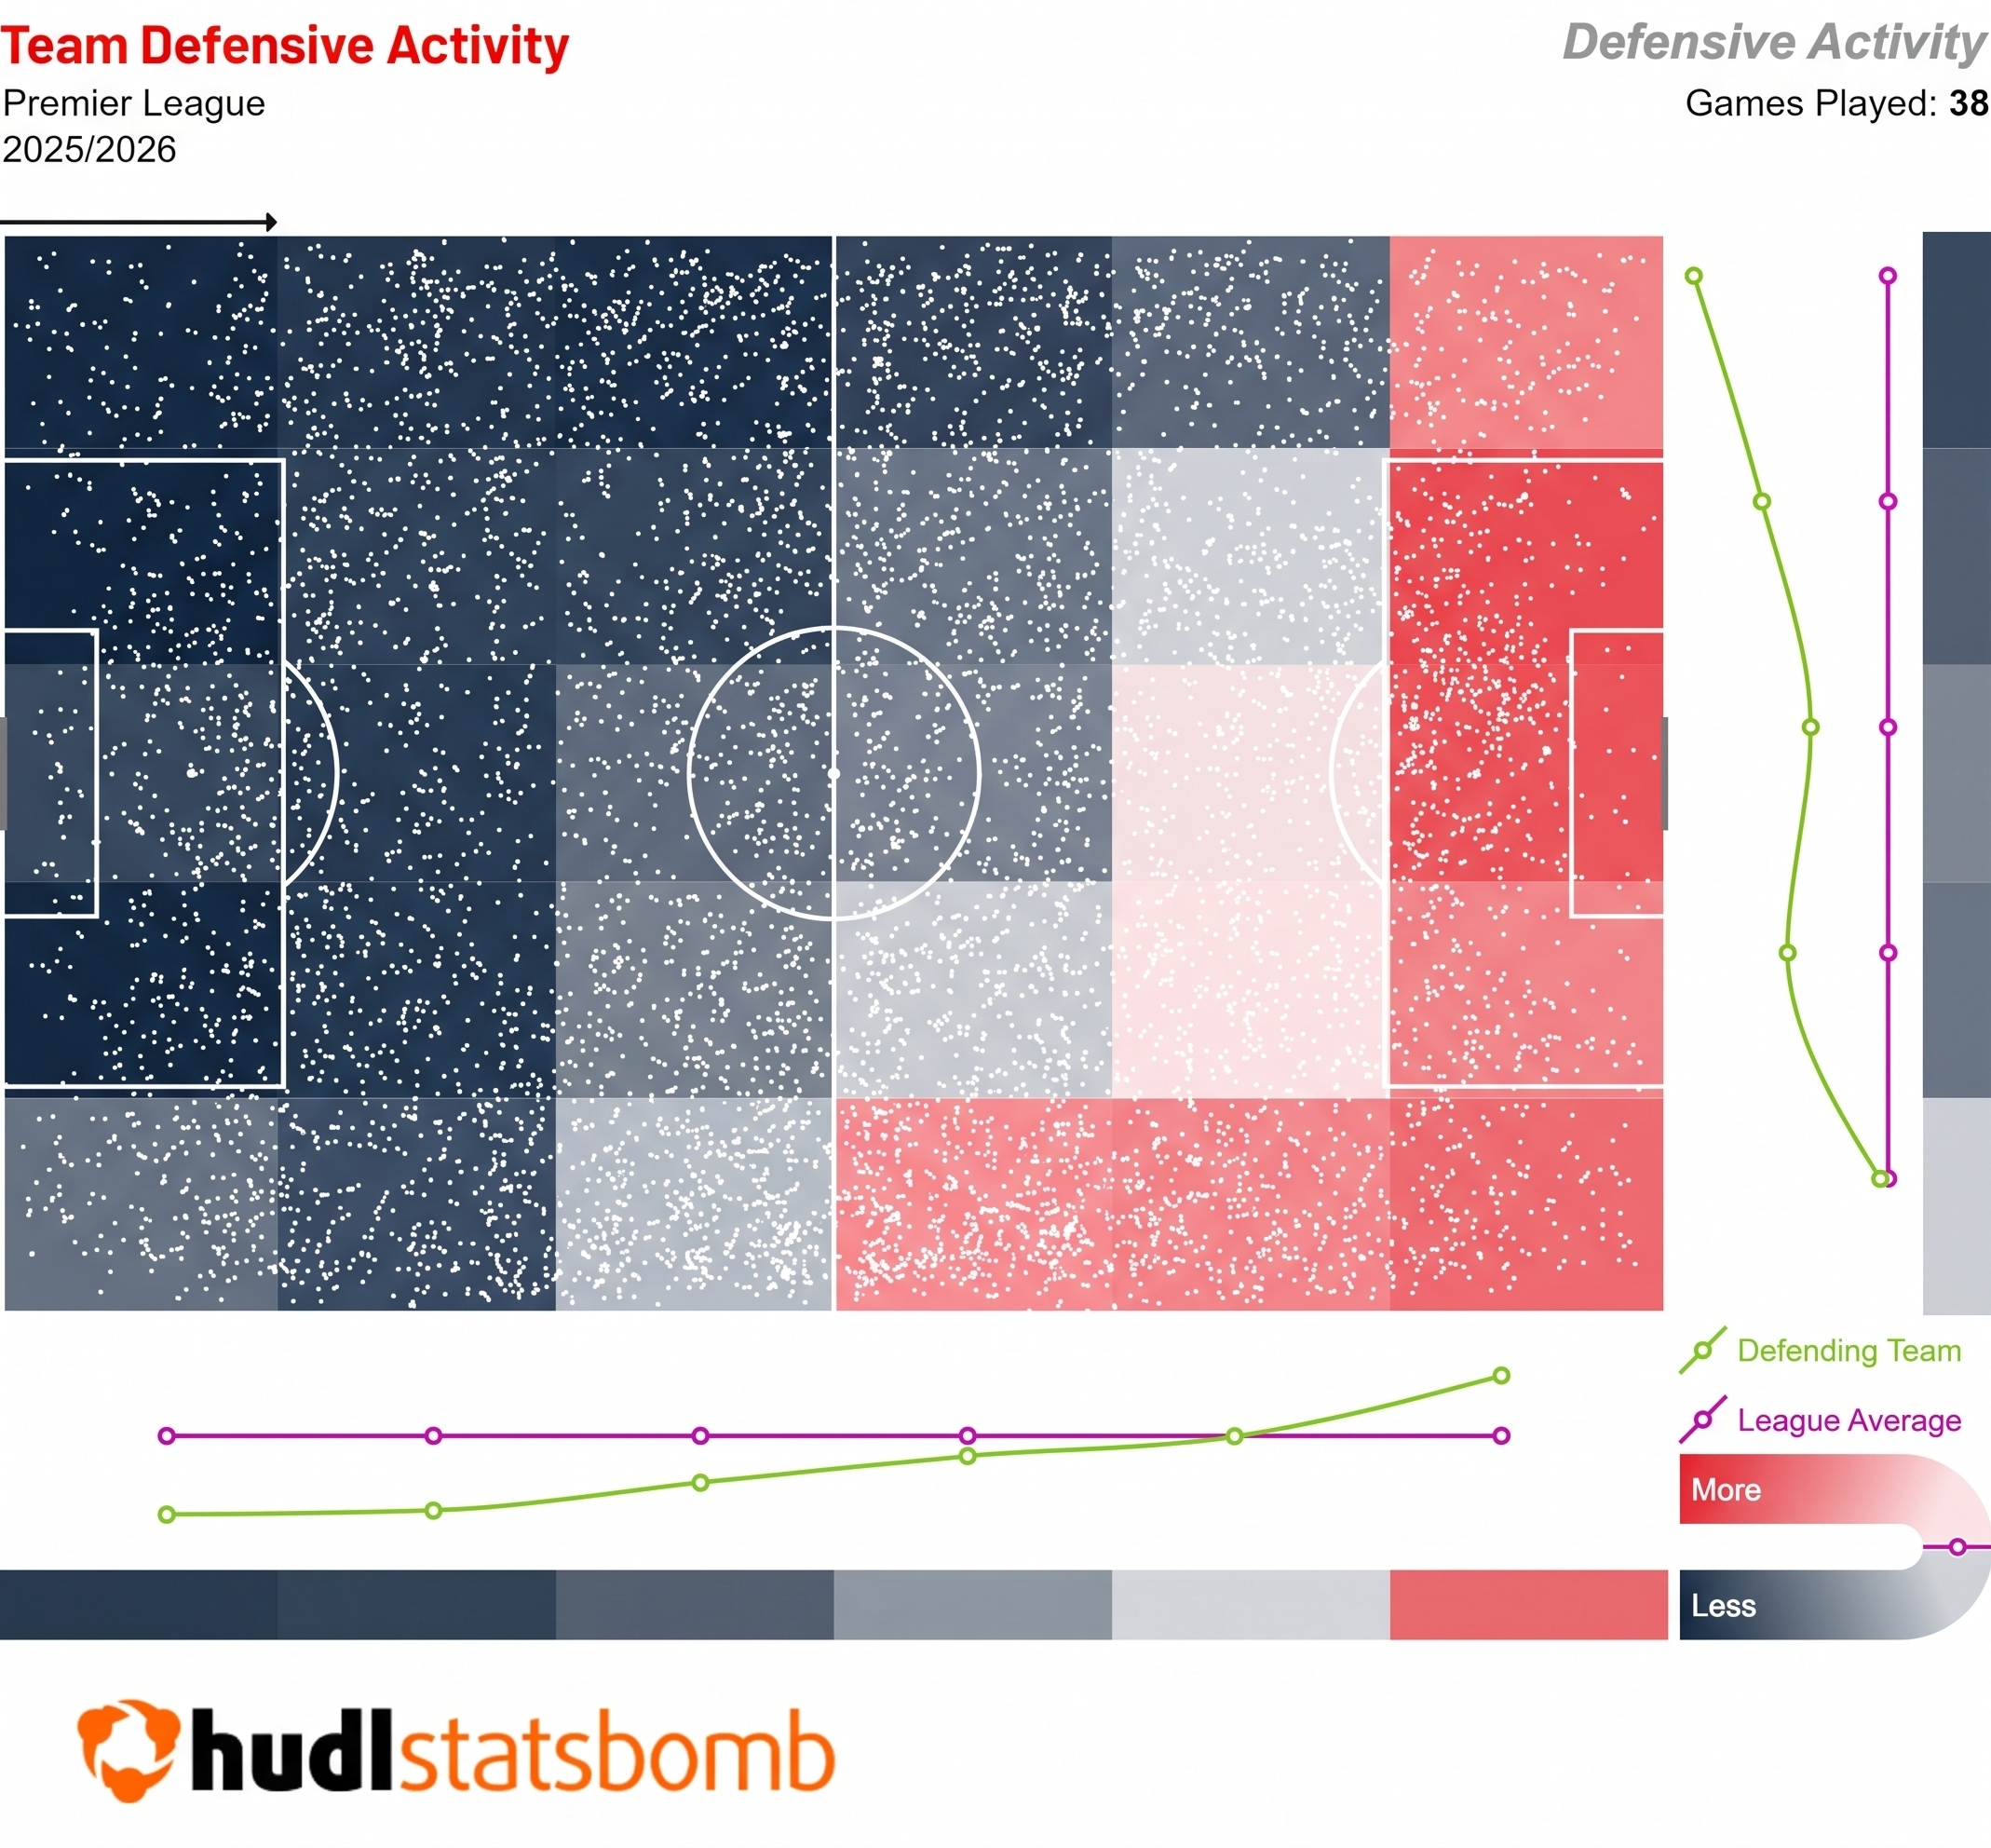
"The home side were brilliant in the press tonight. They suffocated the opposition all game”. Maybe true, but pressing is one of football's most overused observations - and surprisingly one of the hardest to verify.
The eye test can tell you a team pressed. It can't tell you whether the press worked, who stopped running after 65 minutes, or whether the opposition were finding space behind it the whole time.
Hudl Statsbomb pressure data captures every instance a player closes down an opponent within five seconds of receiving the ball, and whether it succeeded. It moves the conversation from "they pressed a lot" to something specific: which zones, which players, and whether the intensity held when the game was actually in the balance.
Putting Pressures to work: Take a match where one side is credited with a high-press system, say, a Champions League game where a Bundesliga side faces a possession-heavy Spanish opponent. Pressure data will show you not just how many times their players closed down within five seconds, but where on the pitch it happened, which players triggered the press, and critically, at what point in the game the intensity dropped.
If a team's successful pressure actions fall by 40% after the 65th minute, you have the story behind the story - not just "their press ran out of steam" as an opinion, but as a measurable fact.
The journalist's angle: Use pressure data to audit a manager's claim. If a coach tells the post-match conference "we pressed brilliantly in the second half," the data will either back them up or politely disagree. That's a story in itself.
Line-breaking Passes
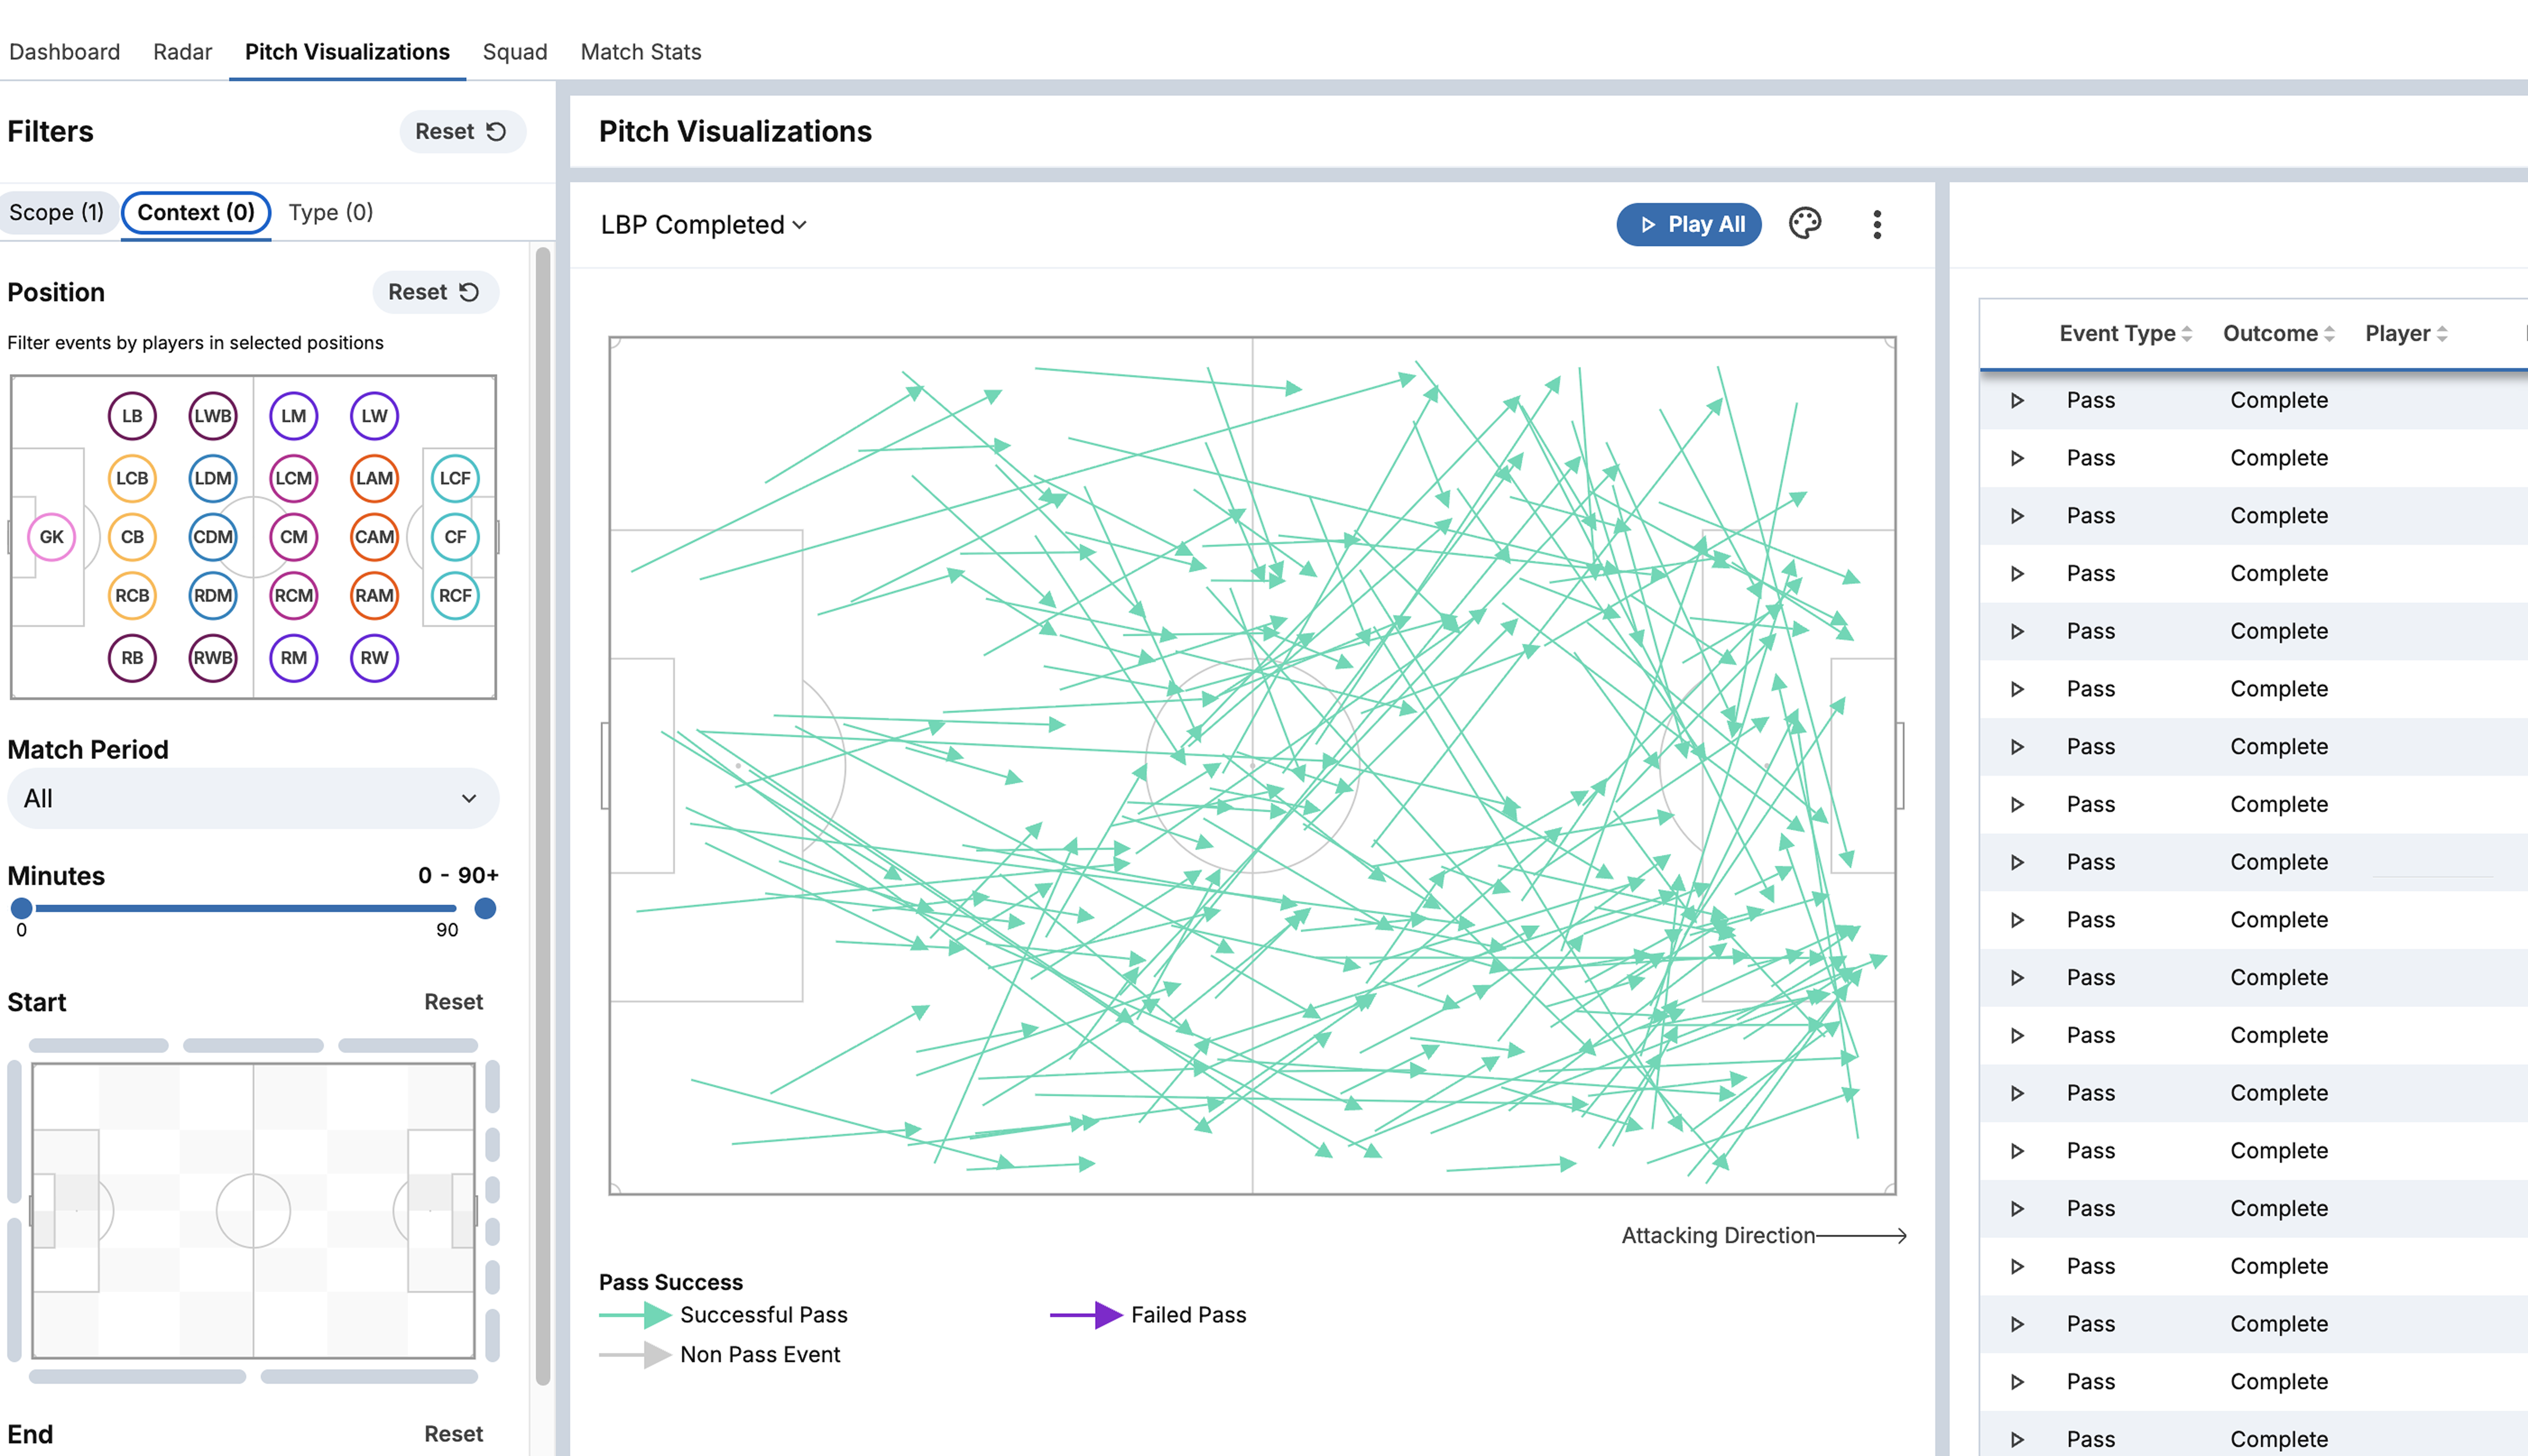
"He's been brilliant at picking passes through the lines tonight." The vision is already there - line-breaking pass data gives you the evidence.
Every pass that travels through or beyond a defensive line - taking defenders out of the game in a single action - is captured and counted. Do it once and its vision. Do it twelve times in ninety minutes, and it's a pattern. Pair it with OBV and you know which of those passes actually hurt the opposition.
The pass that beat three defenders but found a full-back going nowhere? Low OBV. The one that split two centre-backs and put the striker through on goal? That's the number that tells the real story.
Putting Line-Breaking Passes to work: In the 2026 World Cup group stage, a number of midfielders were credited with ‘controlling’ games without ever appearing on the chance creation or assist sheet. Line-breaking passes are where you find the players who were actually dangerous.
A midfielder who plays 12 line-breaking passes in a match is dismantling opposition shape regardless of whether the striker finishes. Pair it with OBV: the passes that broke lines and created high-value situations are where you find the complete picture.
The journalist's angle: Line-breaking passes are the best single stat for identifying a "quarterback" midfielder. Eg: the player who moves a team up the pitch not through dribbling or carrying, but through precision passing. It's the number that backs up the phrase the broadcasters already use, with a description based on proven statistical value, rather than basic instinct.
The Event Data Most Reporters Aren’t Using Yet, But Should Be…
The metrics in the previous section are well-established, the bread and butter of football data analysis. What follows in this section, is understanding that this data is what the next generation of football stories will be written with.
Phases of Play
"The away side controlled that game. They had the ball, they were patient, they just couldn't find a way through." Controlled how? Possession tells you who had the ball. It doesn't tell you whether that possession was purposeful or just recycling in their own half while the opposition sat off them. Those are very different games with the same stat line.
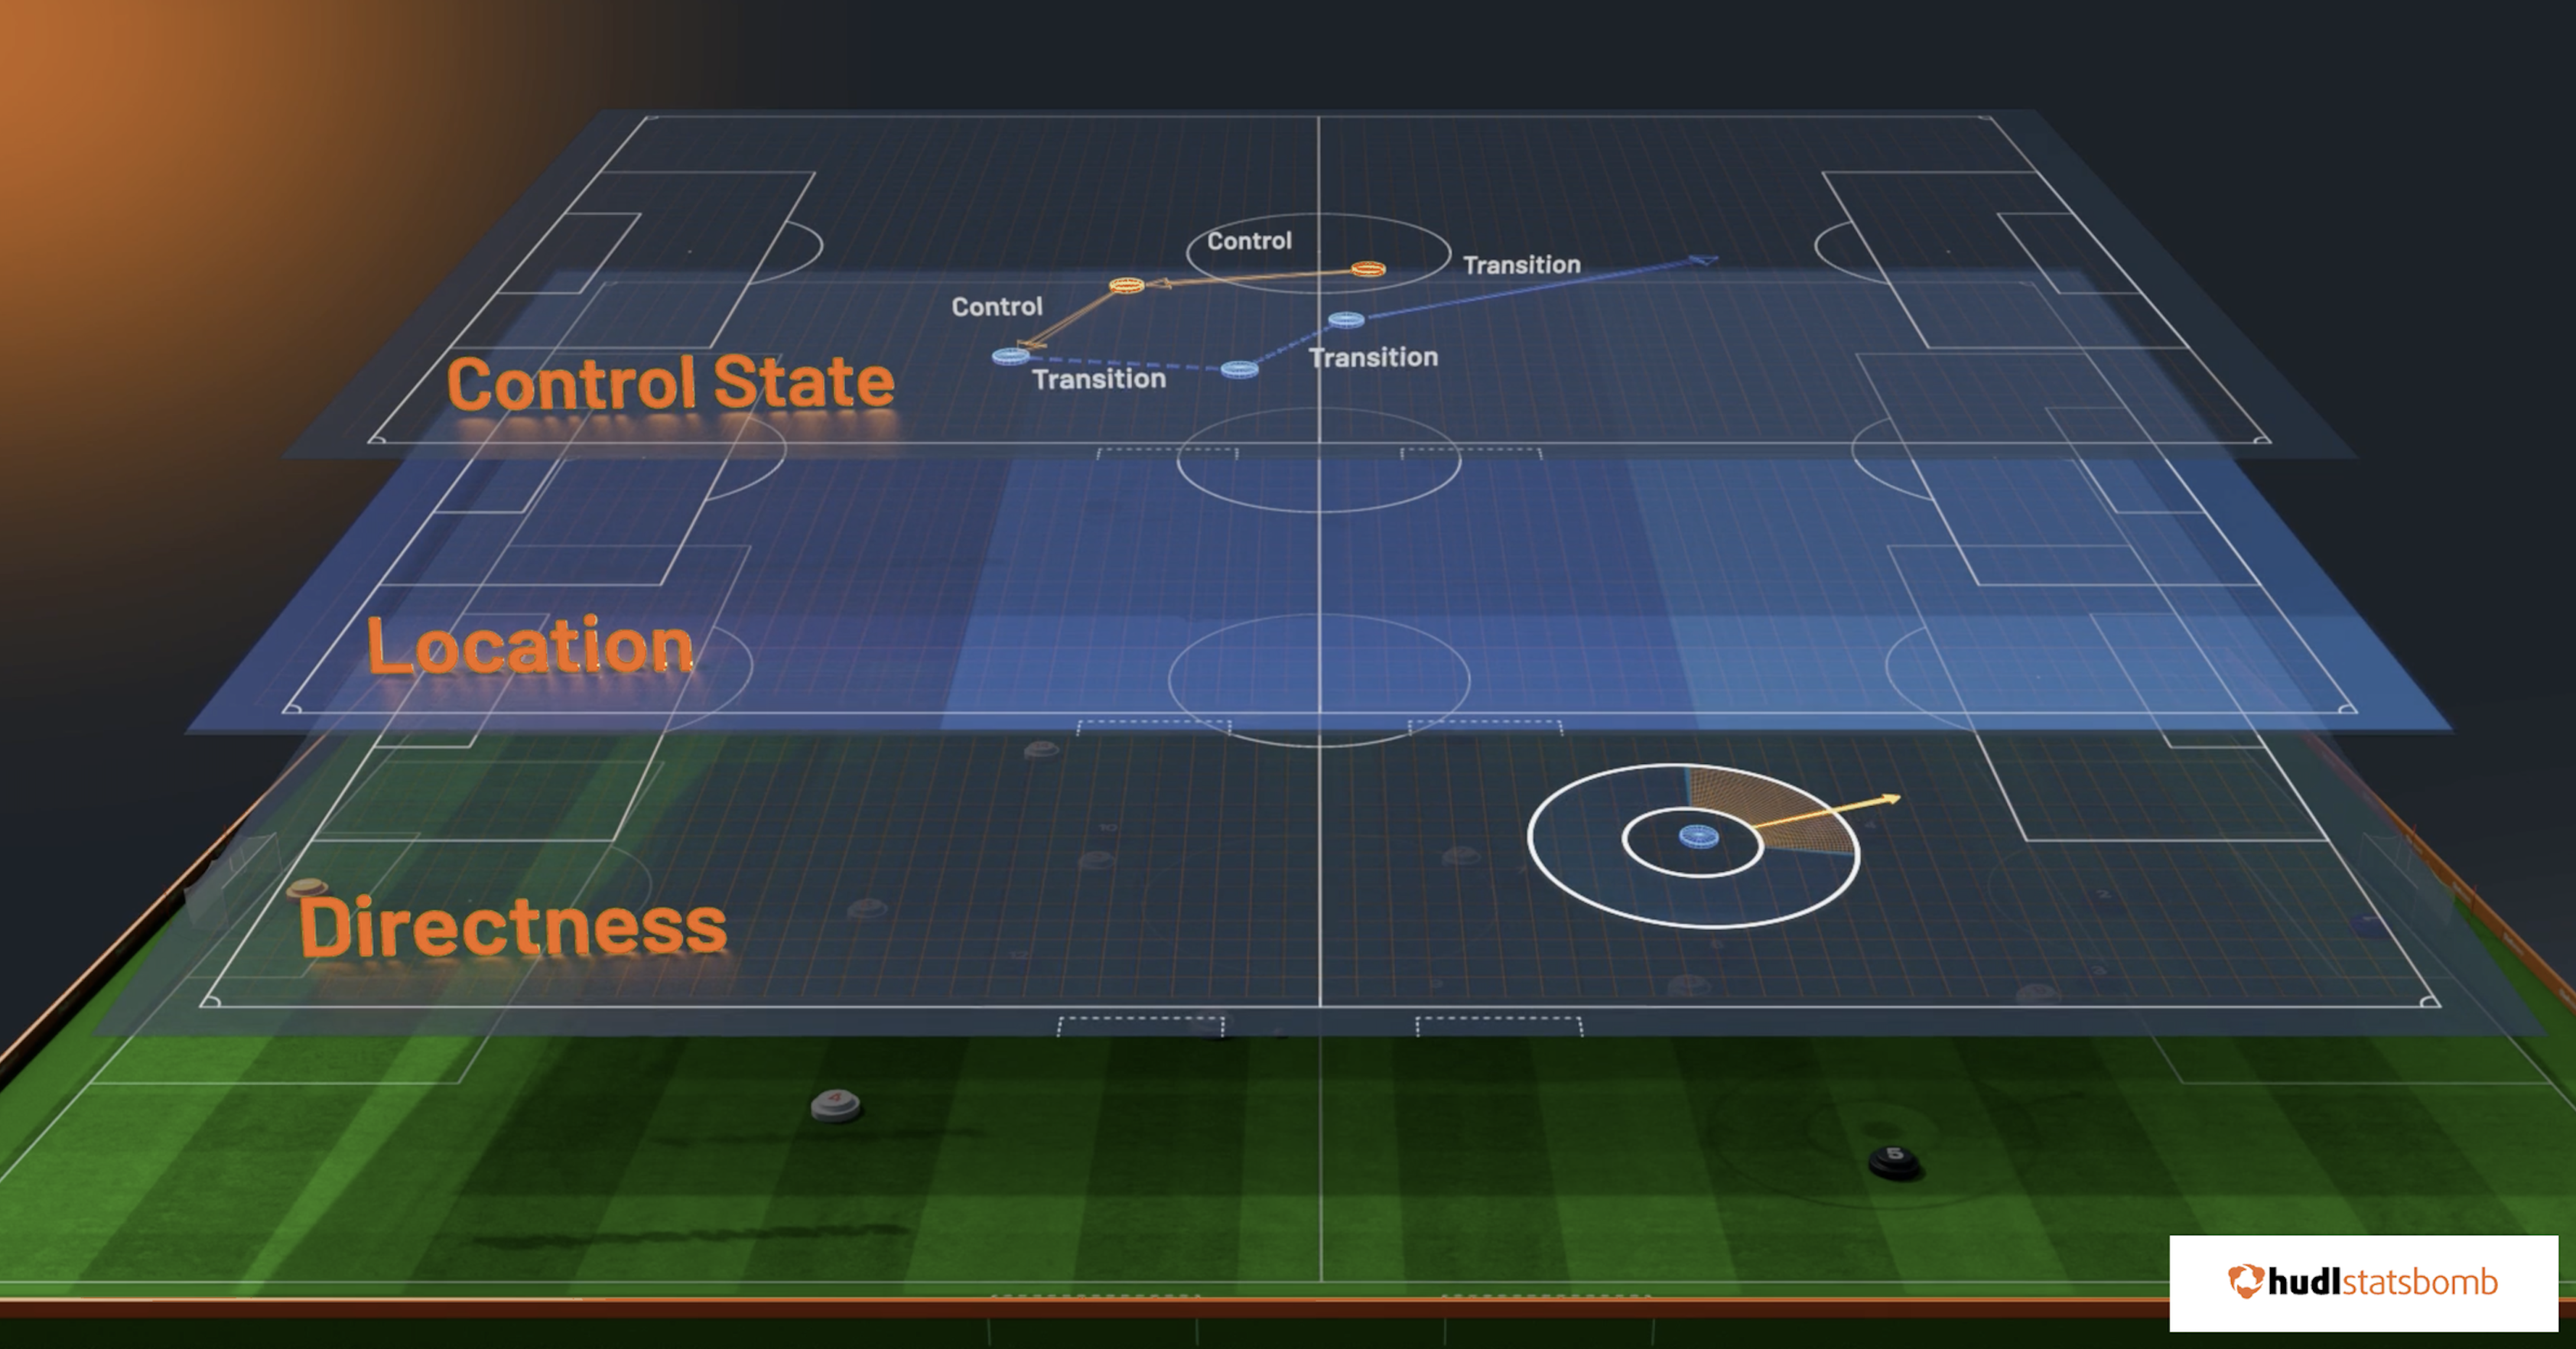
Hudl Statsbomb’s Phases of Play Model adds context to every event in a match: whether a team is in transition or settled control, where on the pitch it's happening, and how directly they're attacking. A pass in an organised build-up is a different action from a pass two seconds after a regain. The data now treats them differently. The striker who barely registers in the xG charts but is devastating in the seconds after a turnover. The midfielder who settles chaos rather than driving through it. The team that "controlled" a game but created almost nothing. Phases of Play is how you prove what your eyes were already telling you.
Putting Phases of Play to work: Picture a match where Team A finishes with 64% possession and the punditry declares them dominant. Phases of Play might show something more complicated: a large proportion of that possession was classified as "recovery": possession retained but going nowhere, often in their own half while the opposition defended deep.
Meanwhile, Team B's 36% possession included a high proportion of transition phases — fast, direct attacks in the seconds after winning the ball. That asymmetry explains why the "dominant" side created very little, and why the match felt tighter than the possession stat suggested.
The journalist's angle: Phases of Play is the tool for covering teams that "control without creating." If a team has the ball but is never threatening, this is how you prove it rather than assert it - this is significantly more compelling than pointing at a chance-creation table.
Practical: An Example Workflow for Reporters Using Hudl Event Data
You don't need to request a custom data pull before every match. Here's how data-savvy reporters are already building event data into their workflow today:
Here's how to structure your match day reporting role using Hudl event data.
Before the game:
Check xG trends over the last five games for both teams. Researching OBV from recent fixtures tells you who's actually been moving their team forward, not just completing passes. Physical metrics tell you who's been covering ground and whether their output holds across ninety minutes. Positional data tells you which zones they're operating in. Before kick-off, that's the difference between assuming a team will press and having evidence of whether they've been able to sustain it.
During the game:
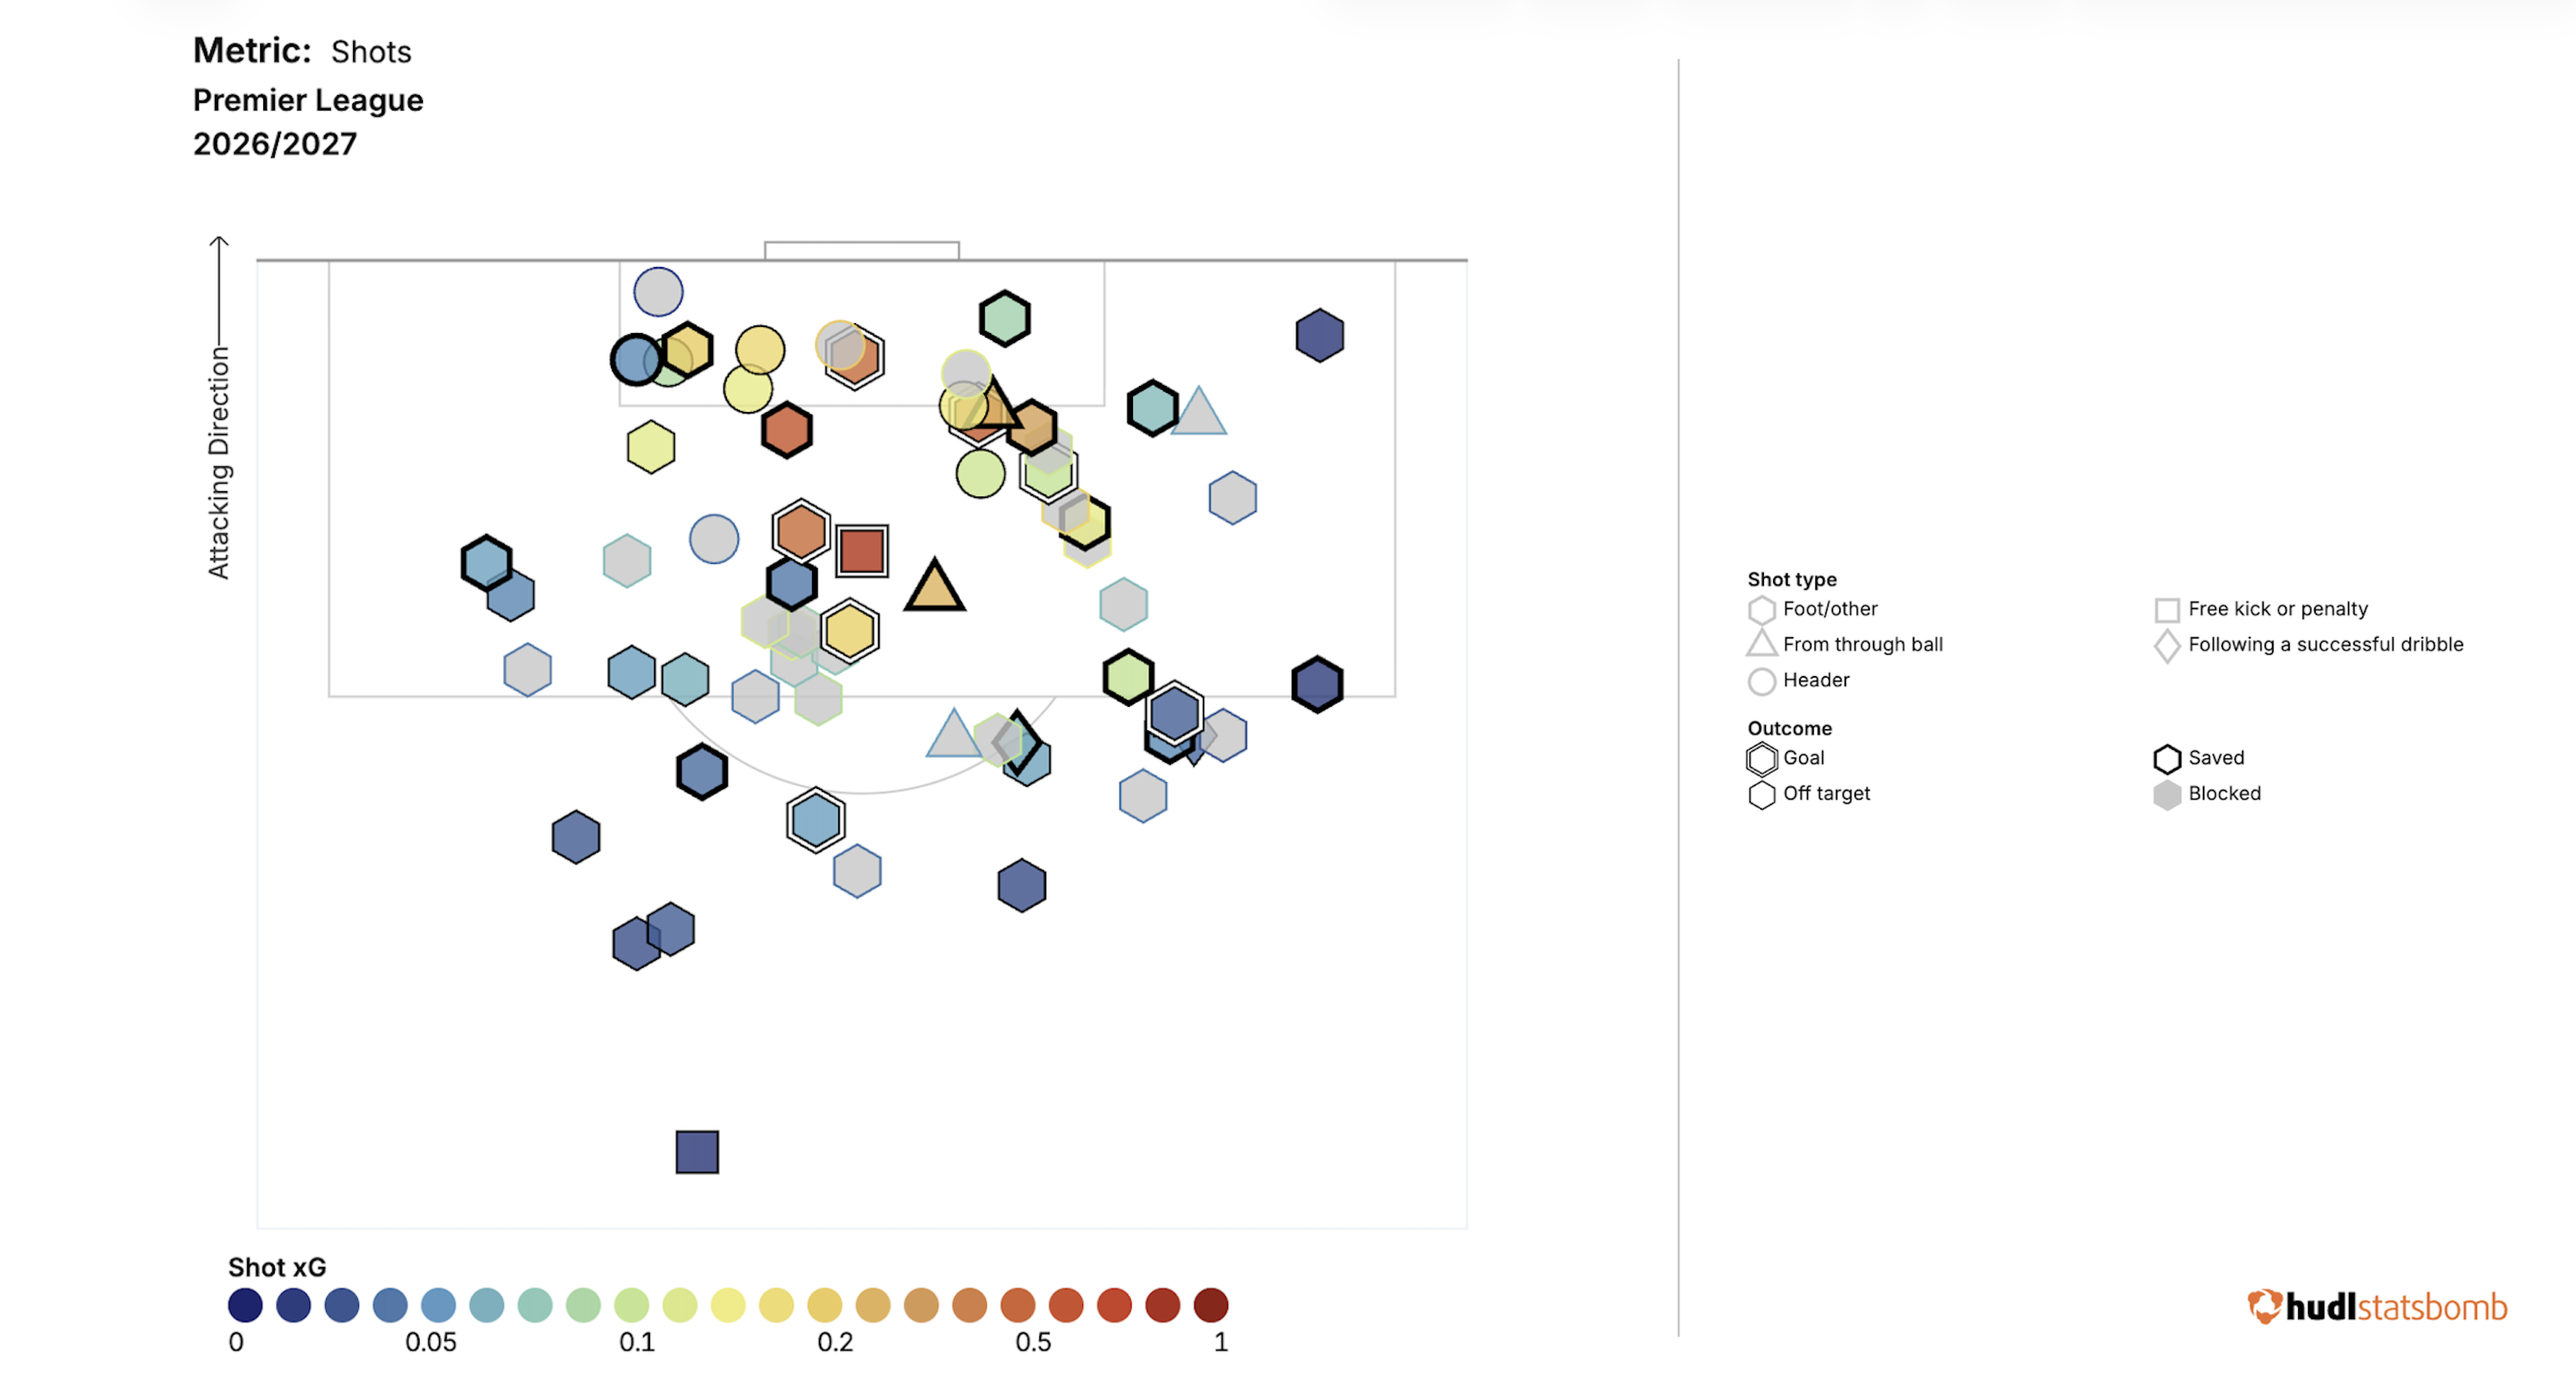
Event data builds the picture in real time. Have the strikers touched the ball in the box? Who's playing into the final third? Is the midfield connecting with the attack, or recycling possession in front of a low block? Our live event data lets you track real-time xG accumulation. By the 60-minute mark, you'll often know whether the scoreline reflects the actual quality of play - or whether a correction is coming.
After the game:
OBV explains the performances that don't show up in the box score. For example, the midfielder who had a quiet game by traditional metrics but generated significant positive OBV through carry sequences. The striker who missed two big chances but whose xG contributions were the highest on the pitch. Produce your match report, your analysis column, your player ratings, your team of the match week, all with concrete statistical data to back it up.
For long-form articles and features:
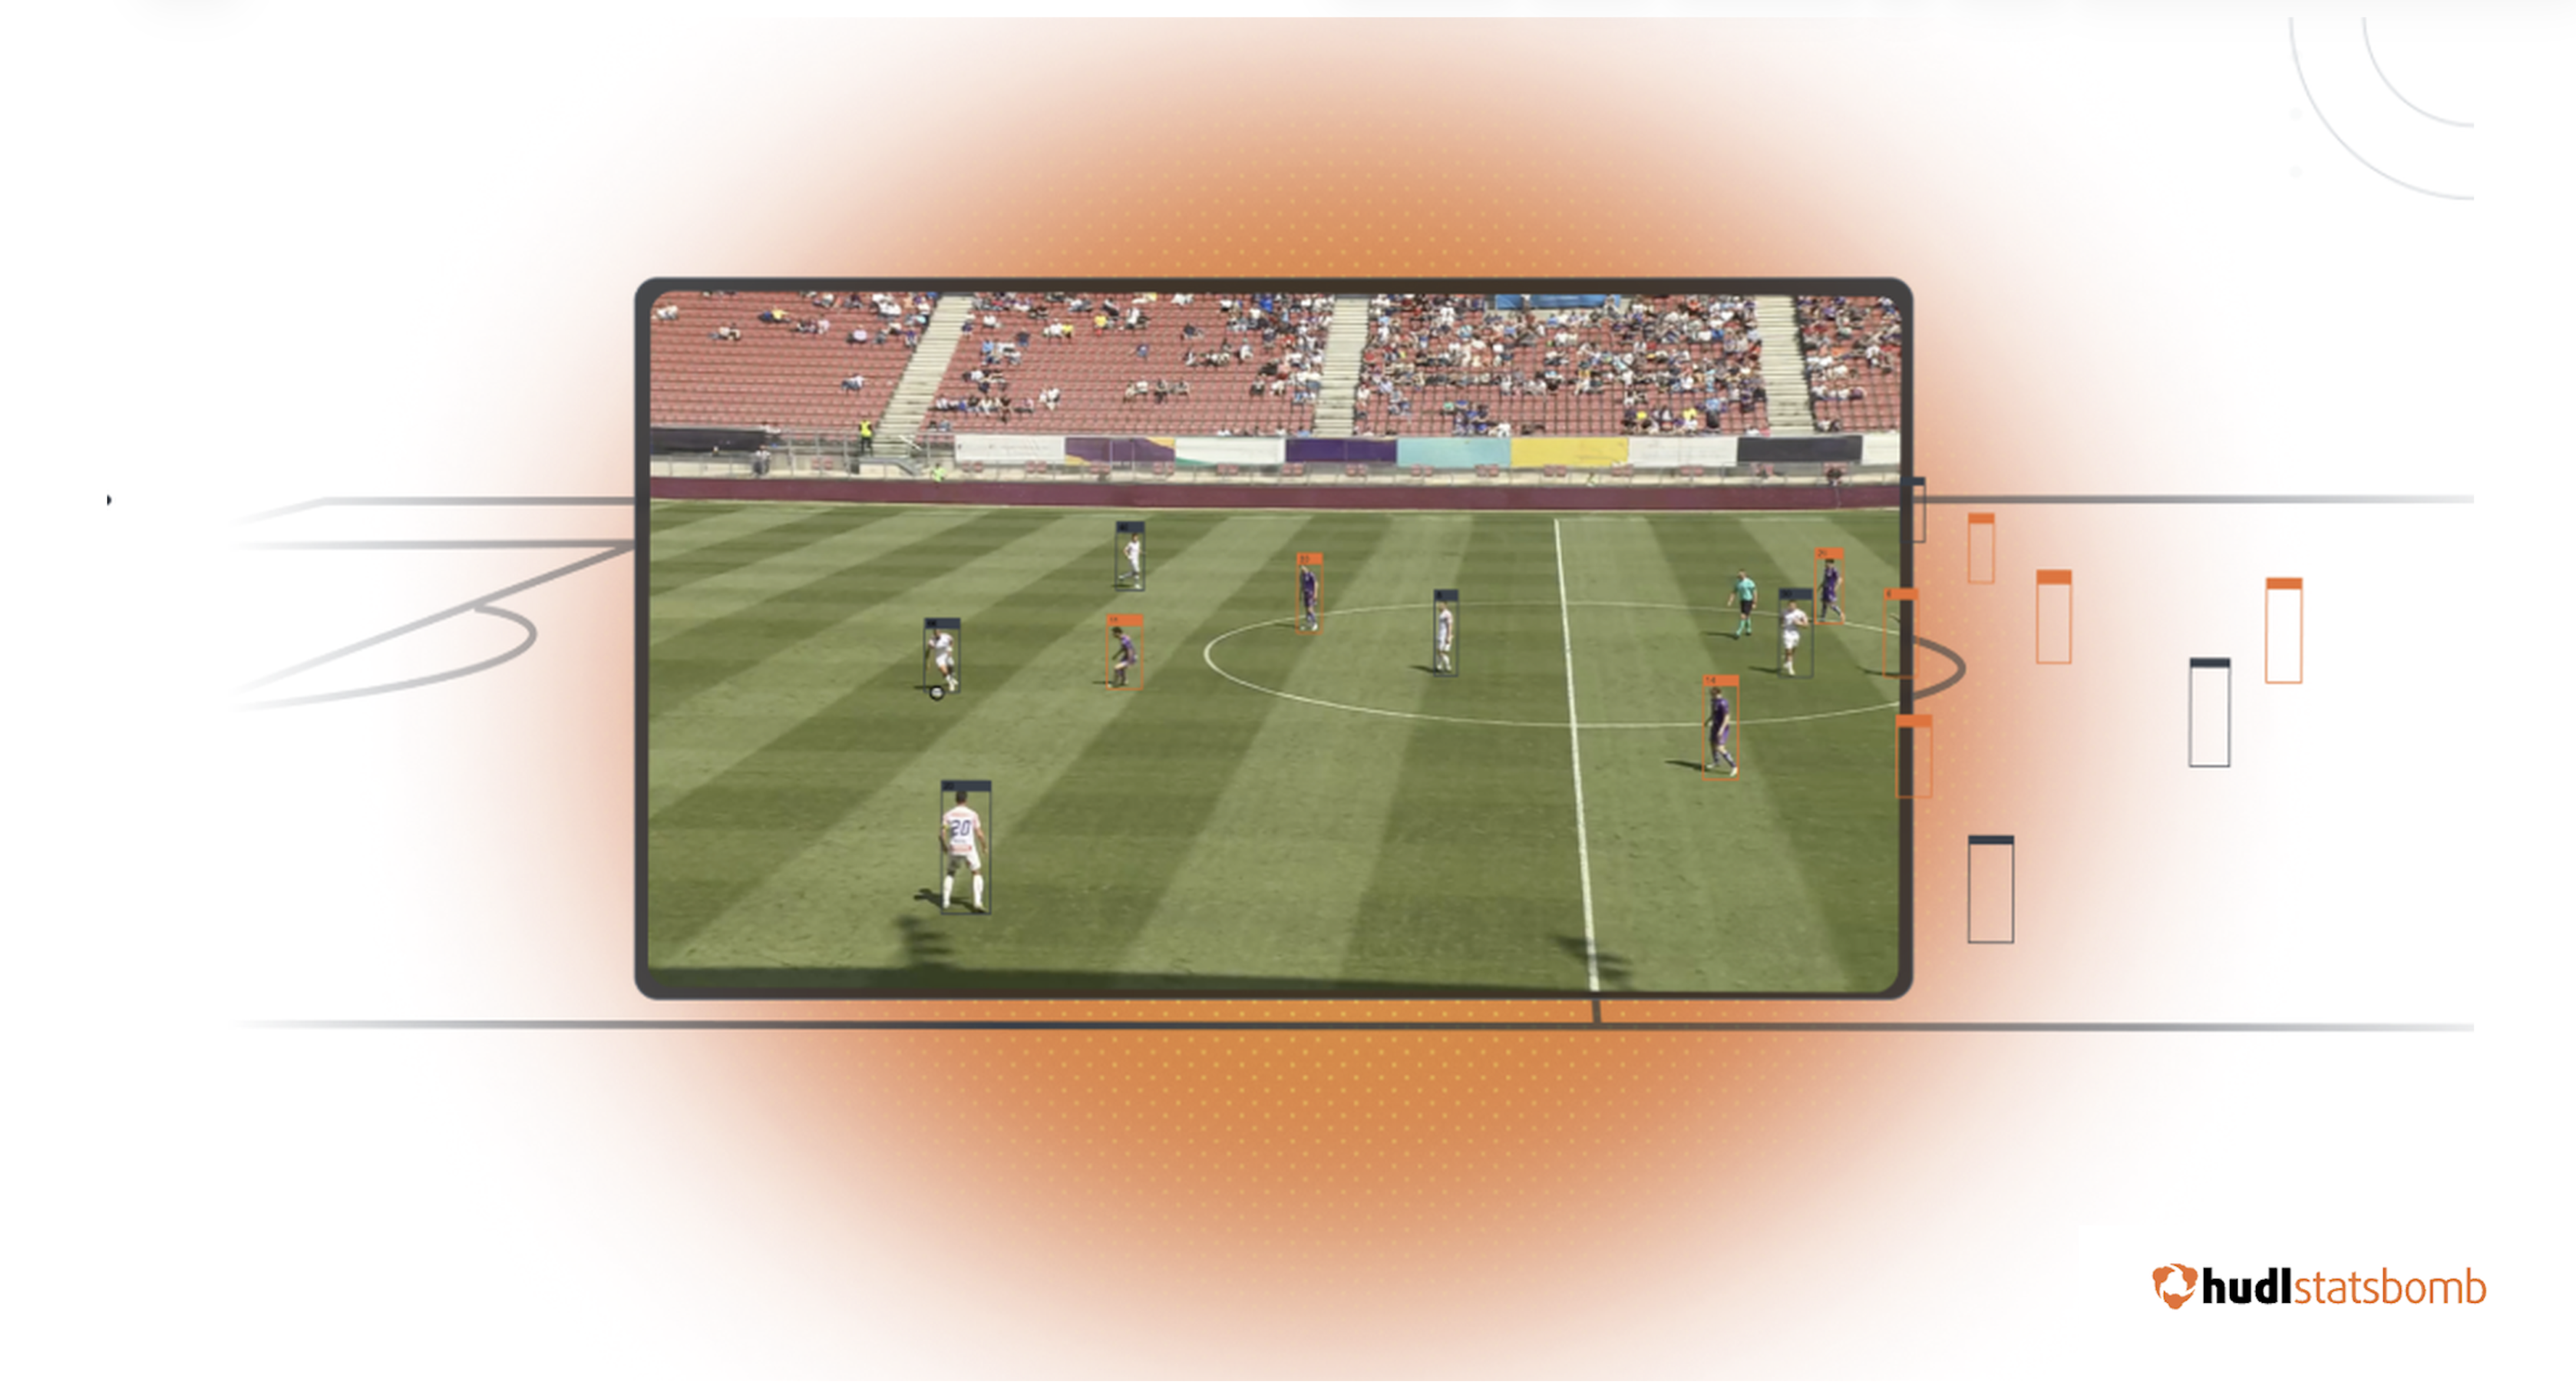
Phases of Play and tracking data give you the tactical depth for analytical pieces: manager profiles, season reviews, and deep dives into why a team's system works (or doesn't).