New in the Hudl Statsbomb API: Phases of Play

Introducing a new event-level model that adds vital context to every action – helping teams understand whether moments happen in control or transition, where they happen, and how directly teams attack
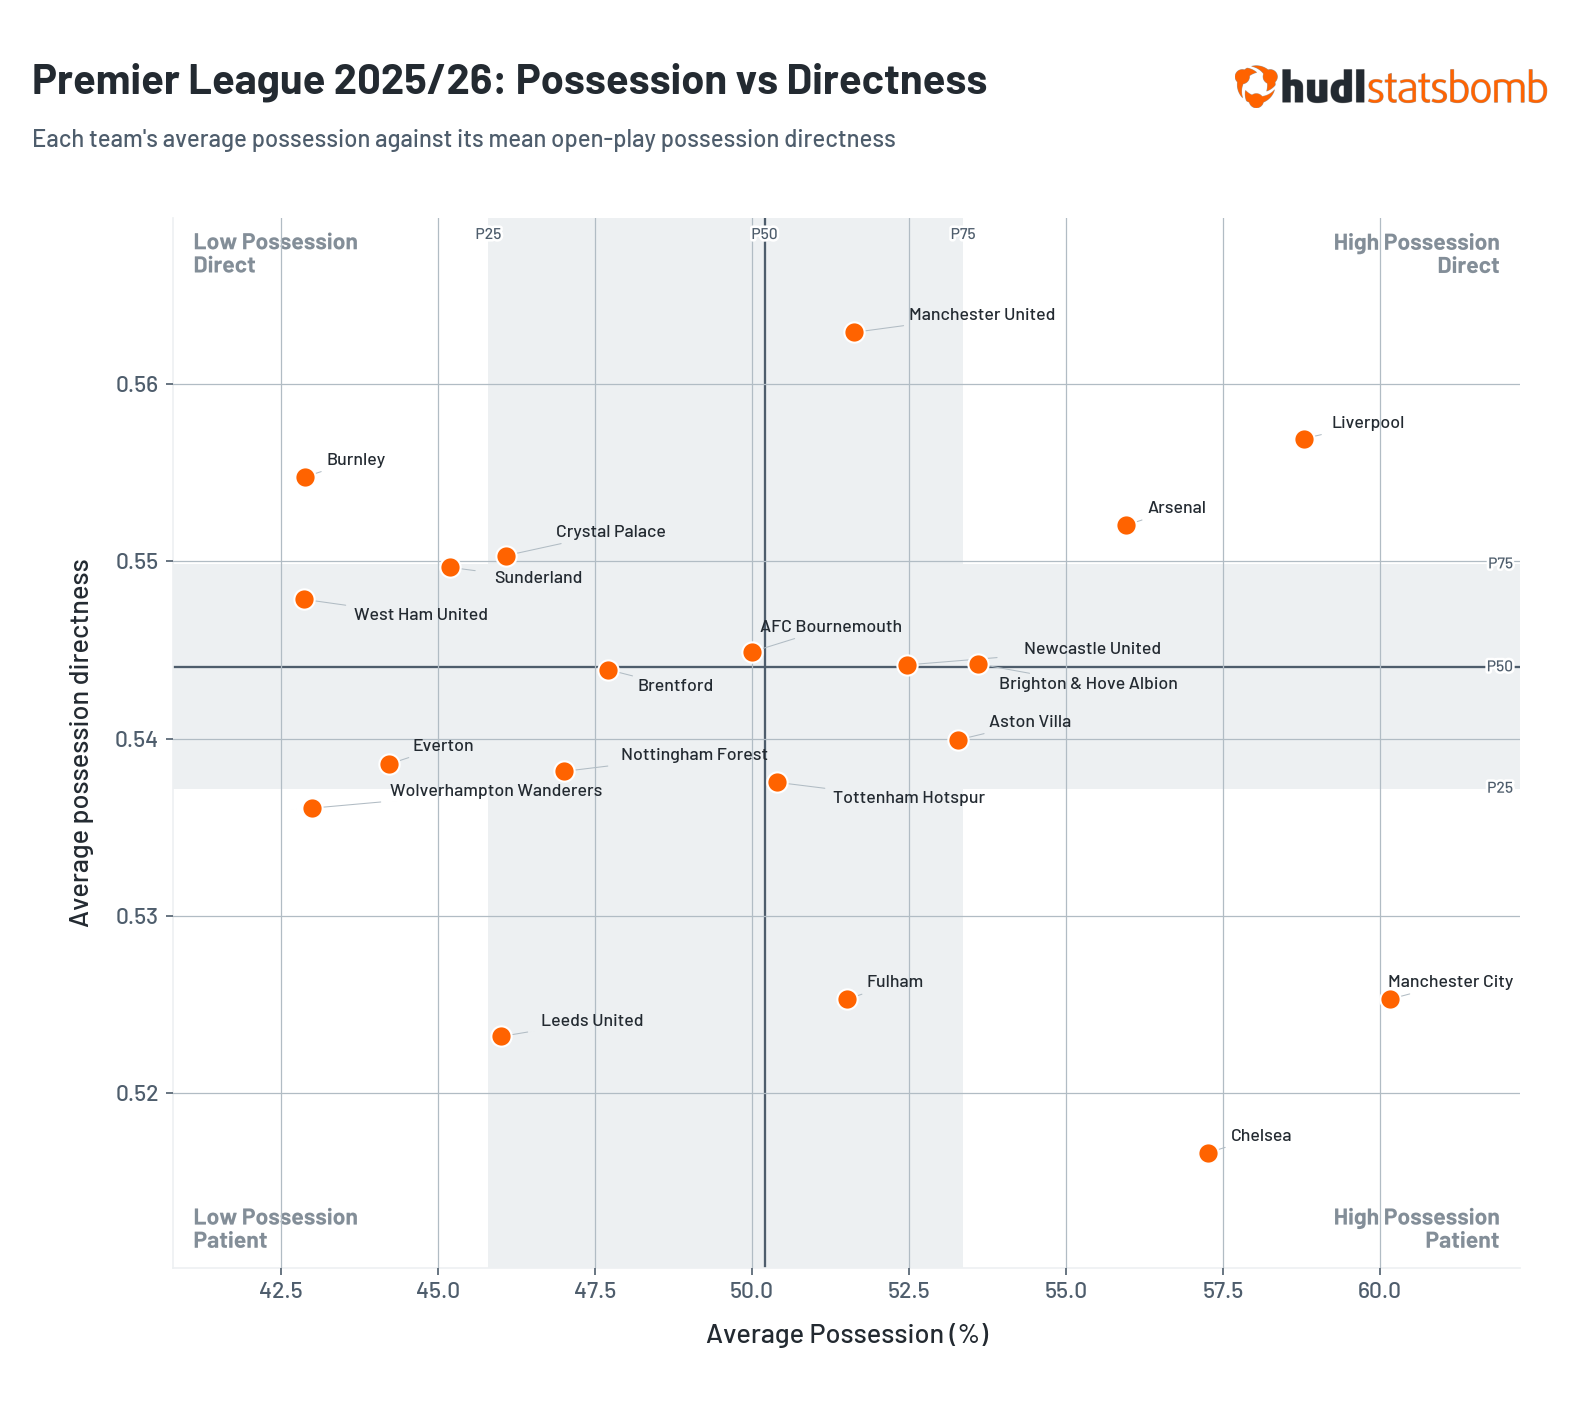
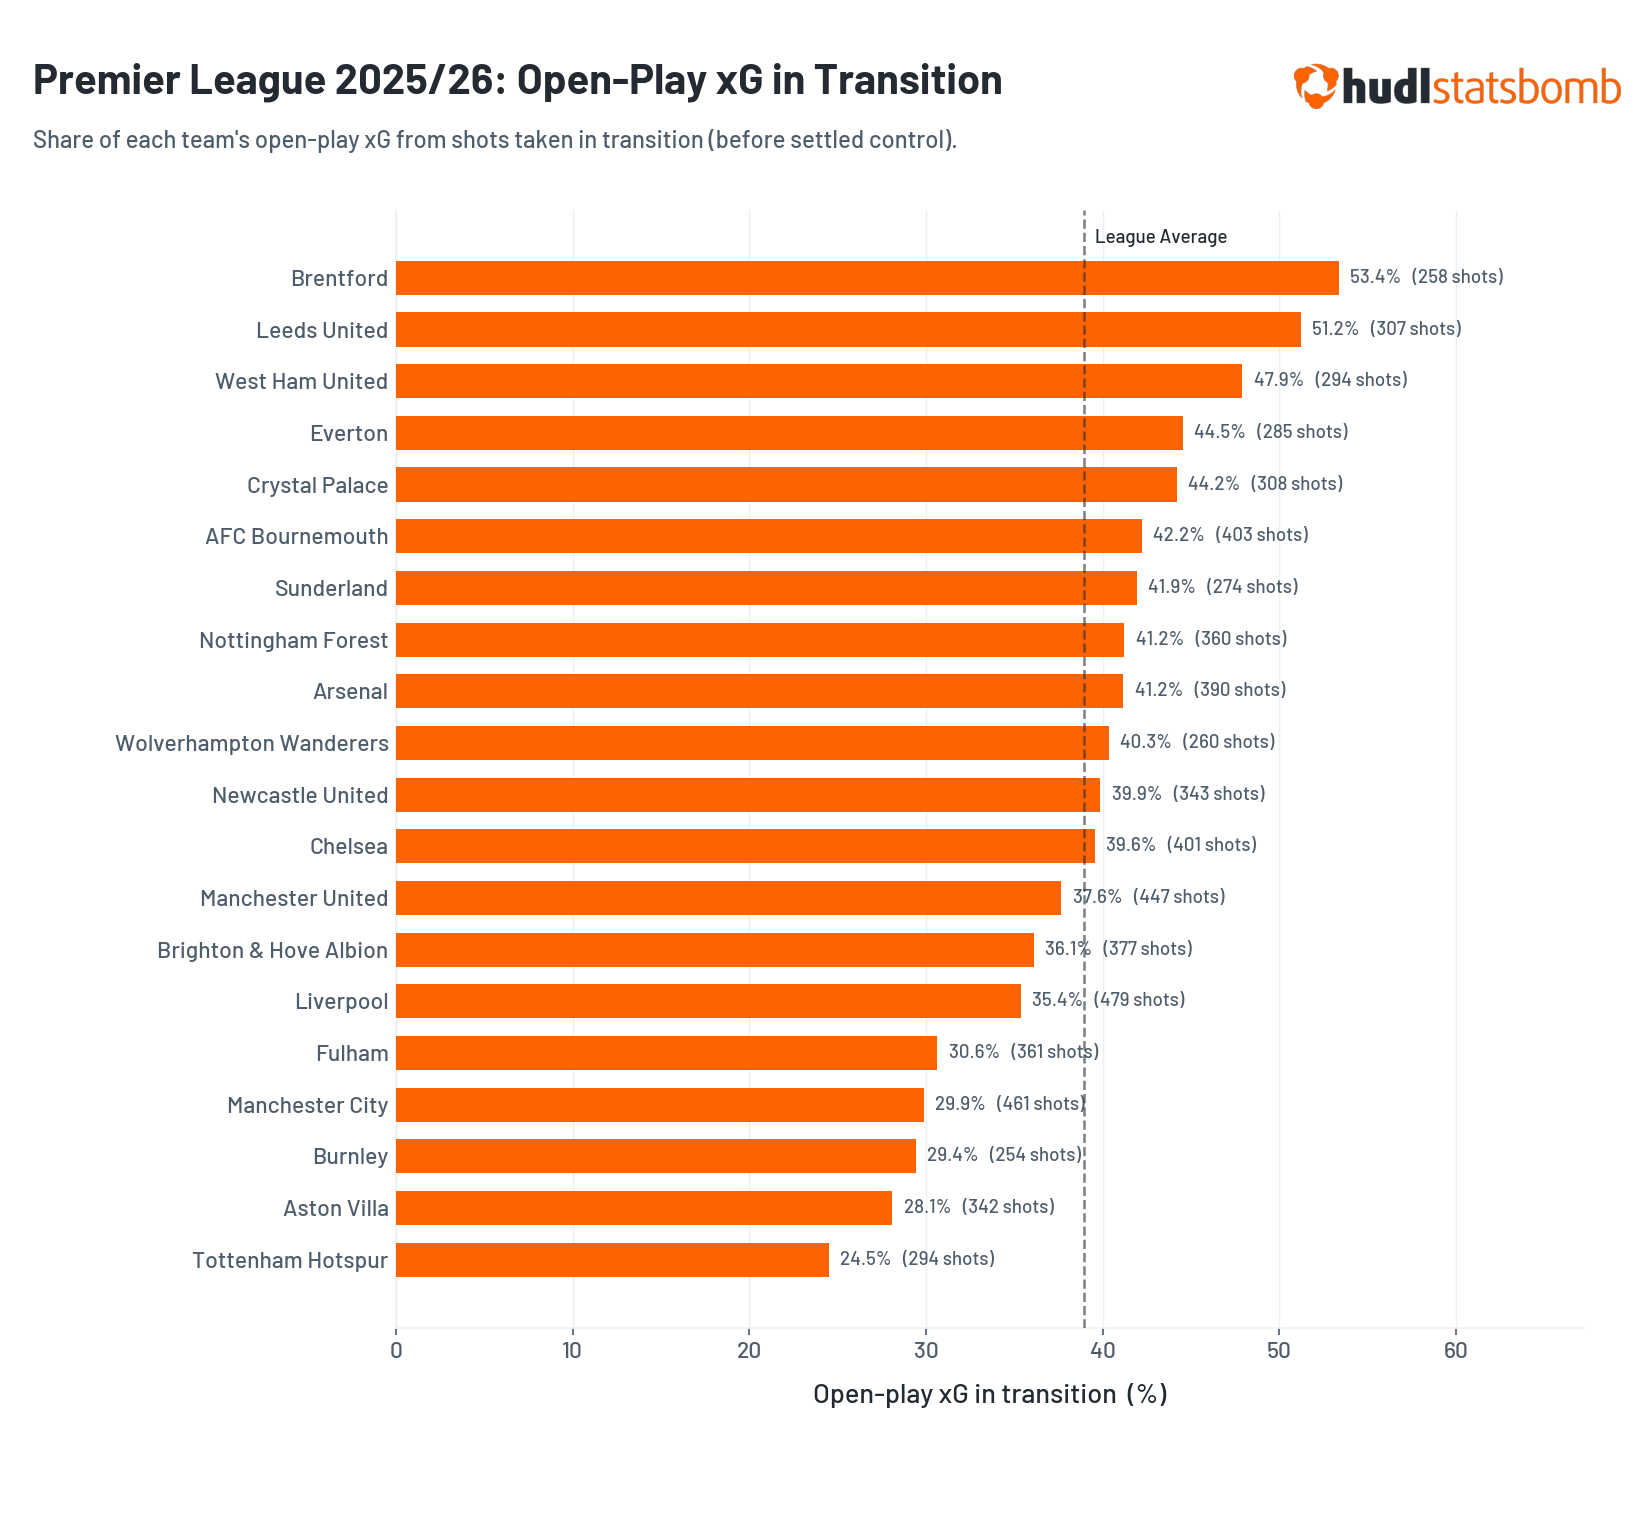
Brentford generate over half of their open-play xG before the defensive block is set — the highest in the division — with Leeds close behind at 51.2%. Arsenal present the more interesting case: 41.2% of their open-play xG comes from transition despite averaging over 55% possession, a reminder that the best attacks are not limited to one mode.
How teams respond to the scoreline adds another layer.
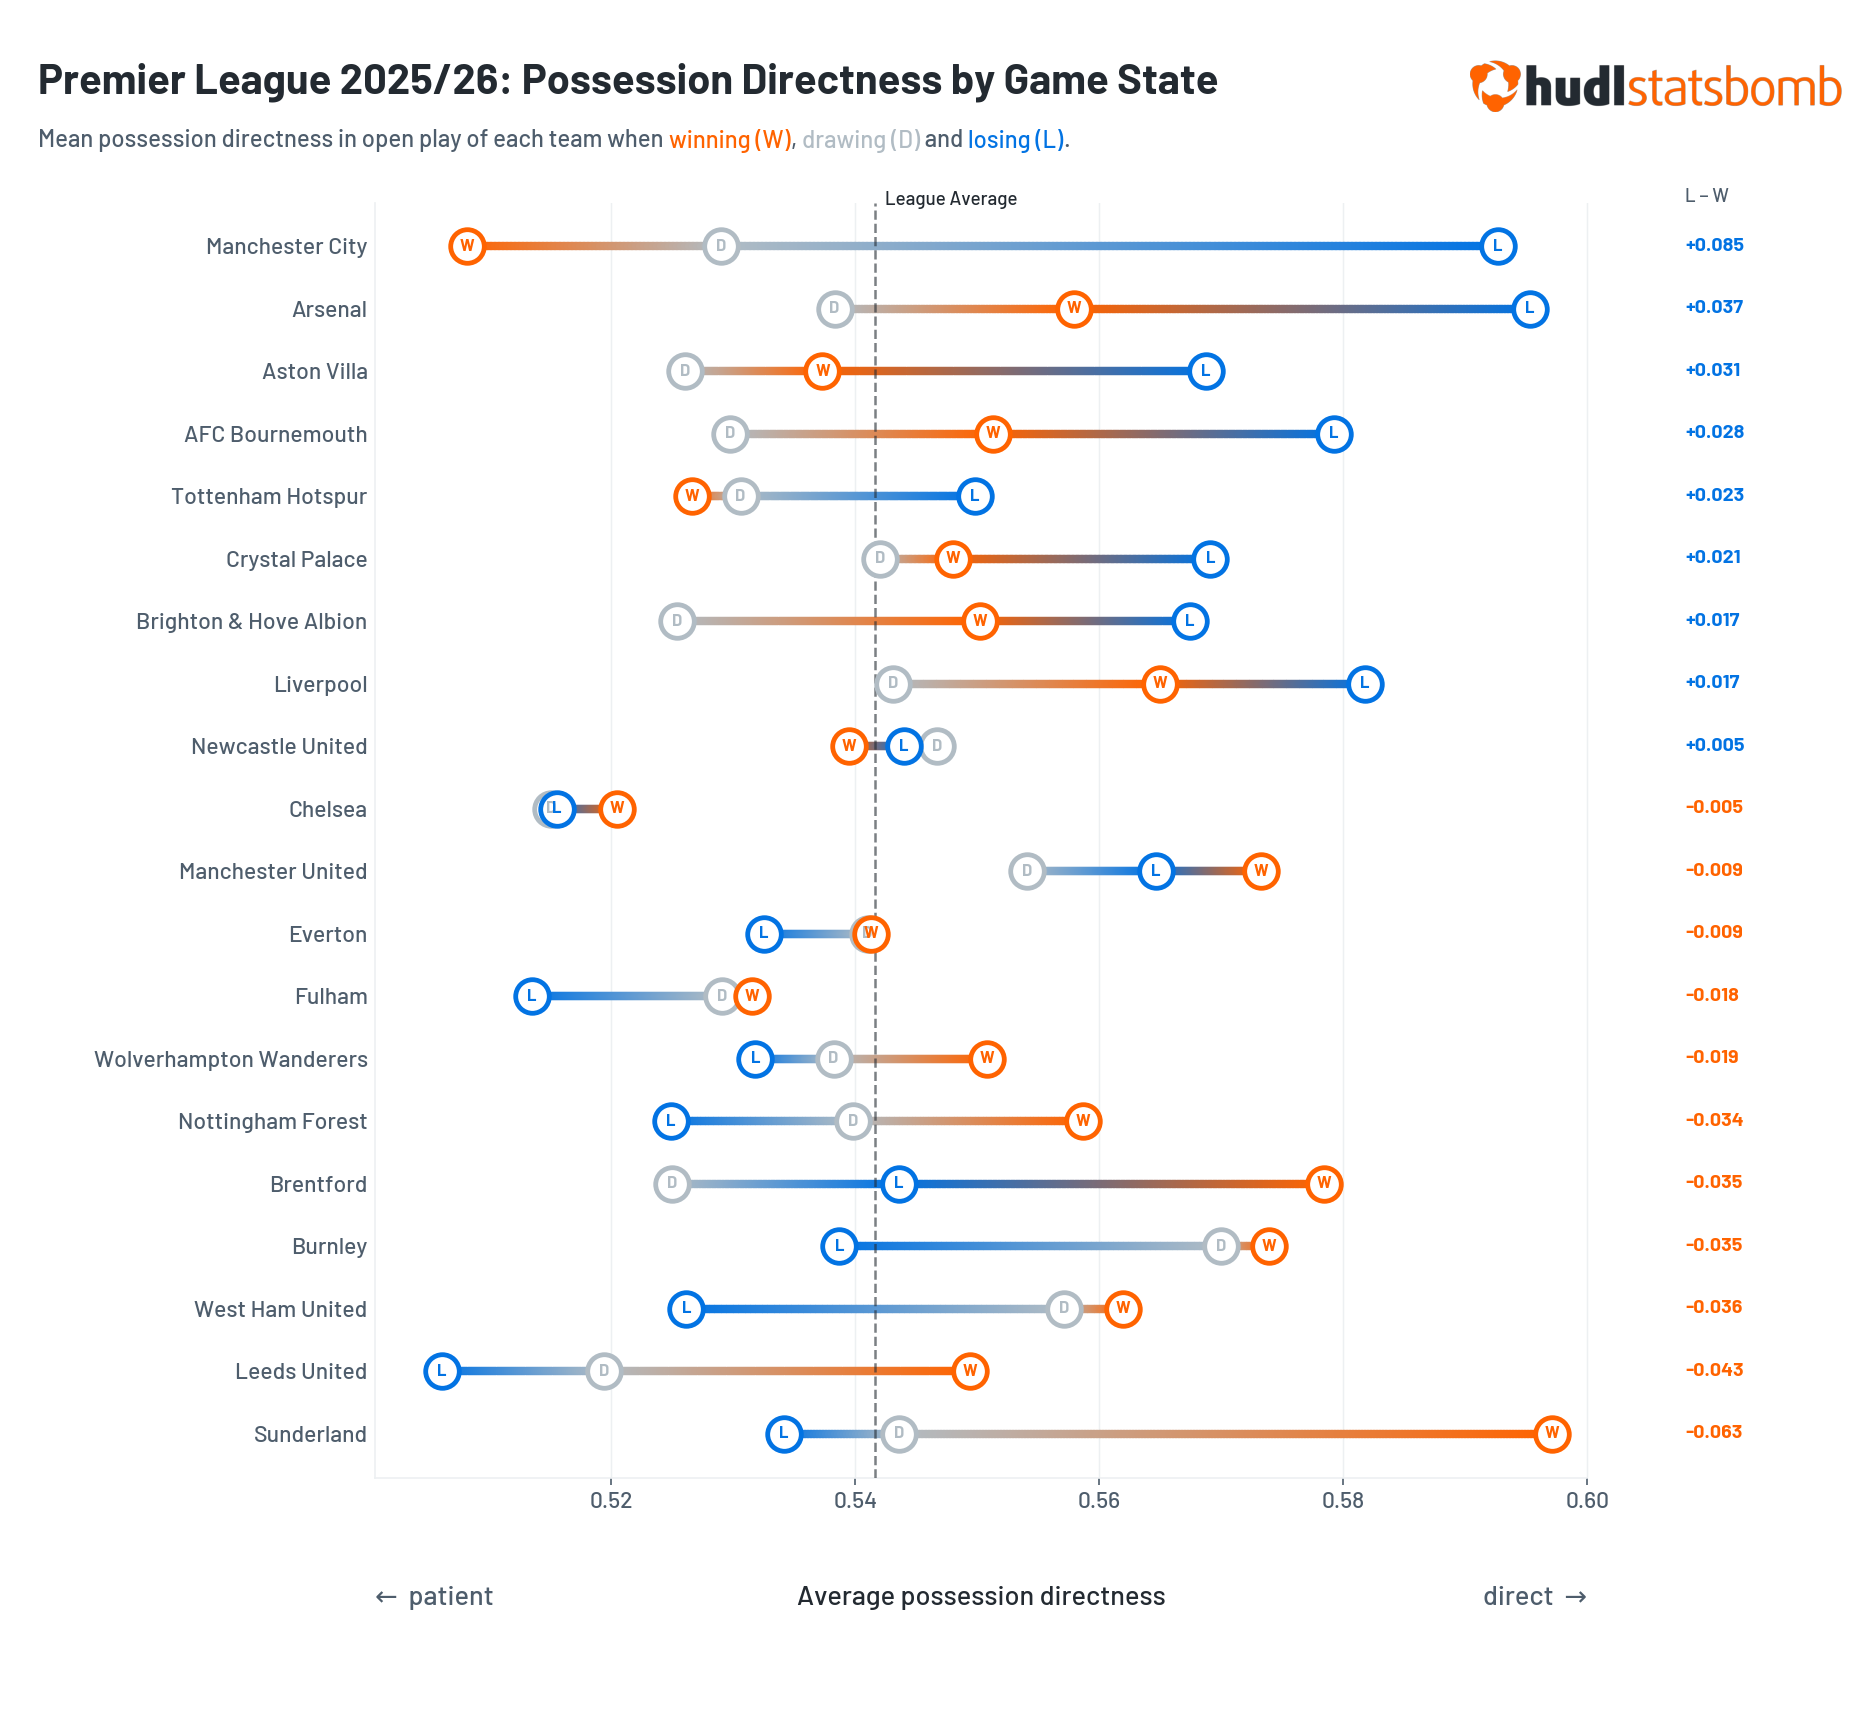
Directness shifts with the scoreline, but not uniformly. Manchester City show the largest swing in the division – patient when ahead, significantly more direct when chasing the game. Sunderland show the opposite, the most direct team in the league when winning, suggesting a side more comfortable defending a lead and countering than maintaining control when ahead. Chelsea show almost no difference across game states – commitment to a specific style, or tactical rigidity?
For match analysts, this is a starting point for understanding how opponents adapt to game state. For recruitment, it raises a more specific question: which players are actually driving these profiles?
Which forwards are most dangerous before the block resets?
Some attackers thrive in settled possession. Others are most dangerous in the seconds after a regain, when defences haven't reorganised and space exists before it closes. Those are fundamentally different profiles – and without phase context, the data treats them identically.
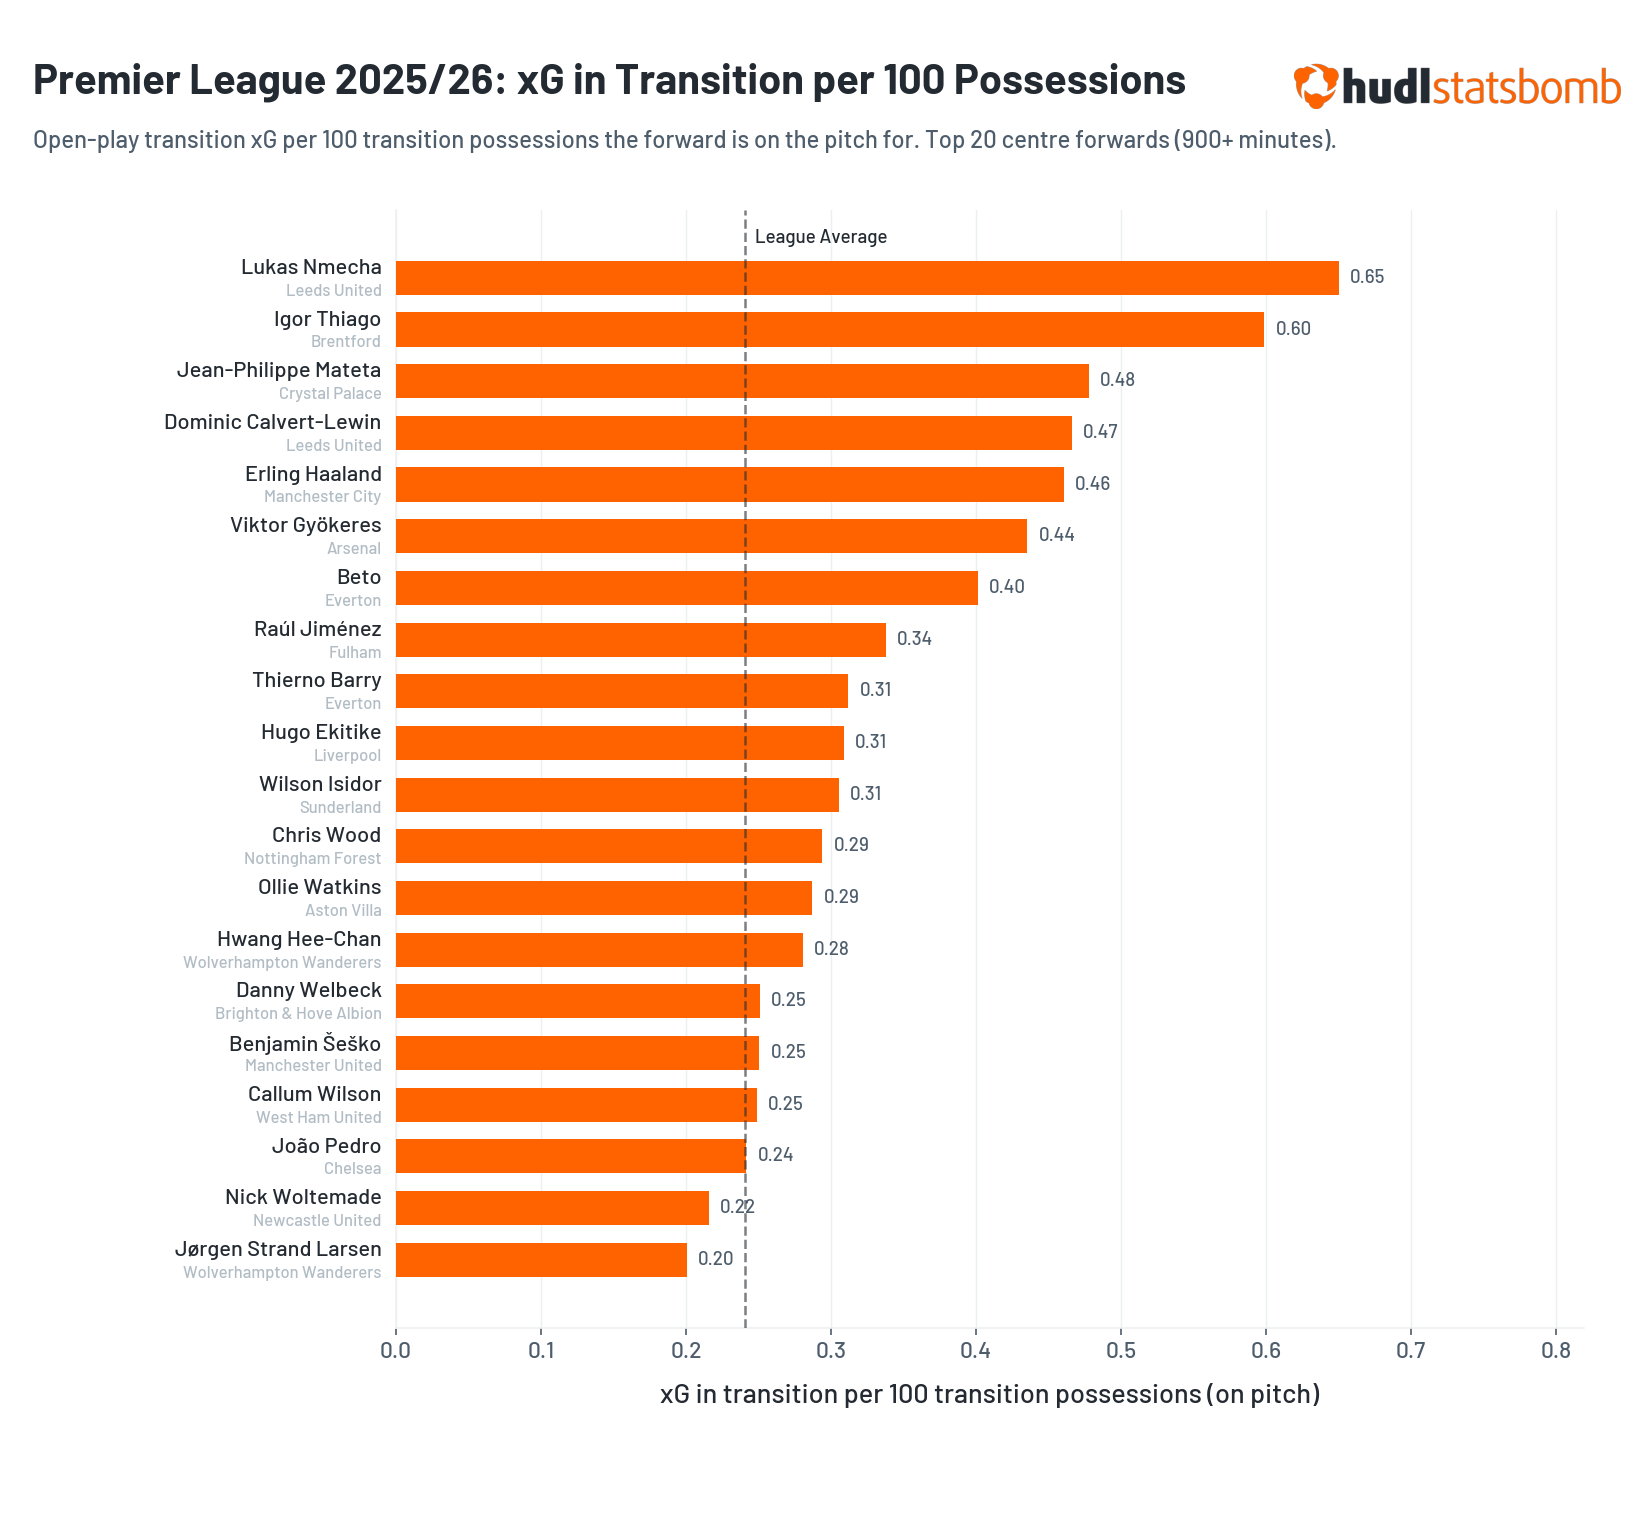
Given that Brentford and Leeds generate so much of their xG from transition, it is no surprise to see Lukas Nmecha and Igor Thiago lead the division. But that is precisely where the recruitment question sharpens: while Thiago's absolute numbers are impressive, the more relevant question for any interested club is whether that output translates outside a transition-heavy game model. Phases of Play does not just tell you what a player produced – it tells you the conditions under which they produced it.
Which midfielders can settle chaos and still move the team forward?
This is one of the hardest profiles to identify without phase context. Clubs are not simply looking for midfielders who complete passes. They want players who can not only receive under pressure, help the team shift from In Possession: Transition into In Possession: Control, but who can also choose the right moment within that controlled possession to progress the attack. That combination rarely shows up in conventional metrics.
Directness lets us be more specific: which midfielders are actively reducing the tempo and helping to establish control rather than driving forward immediately?
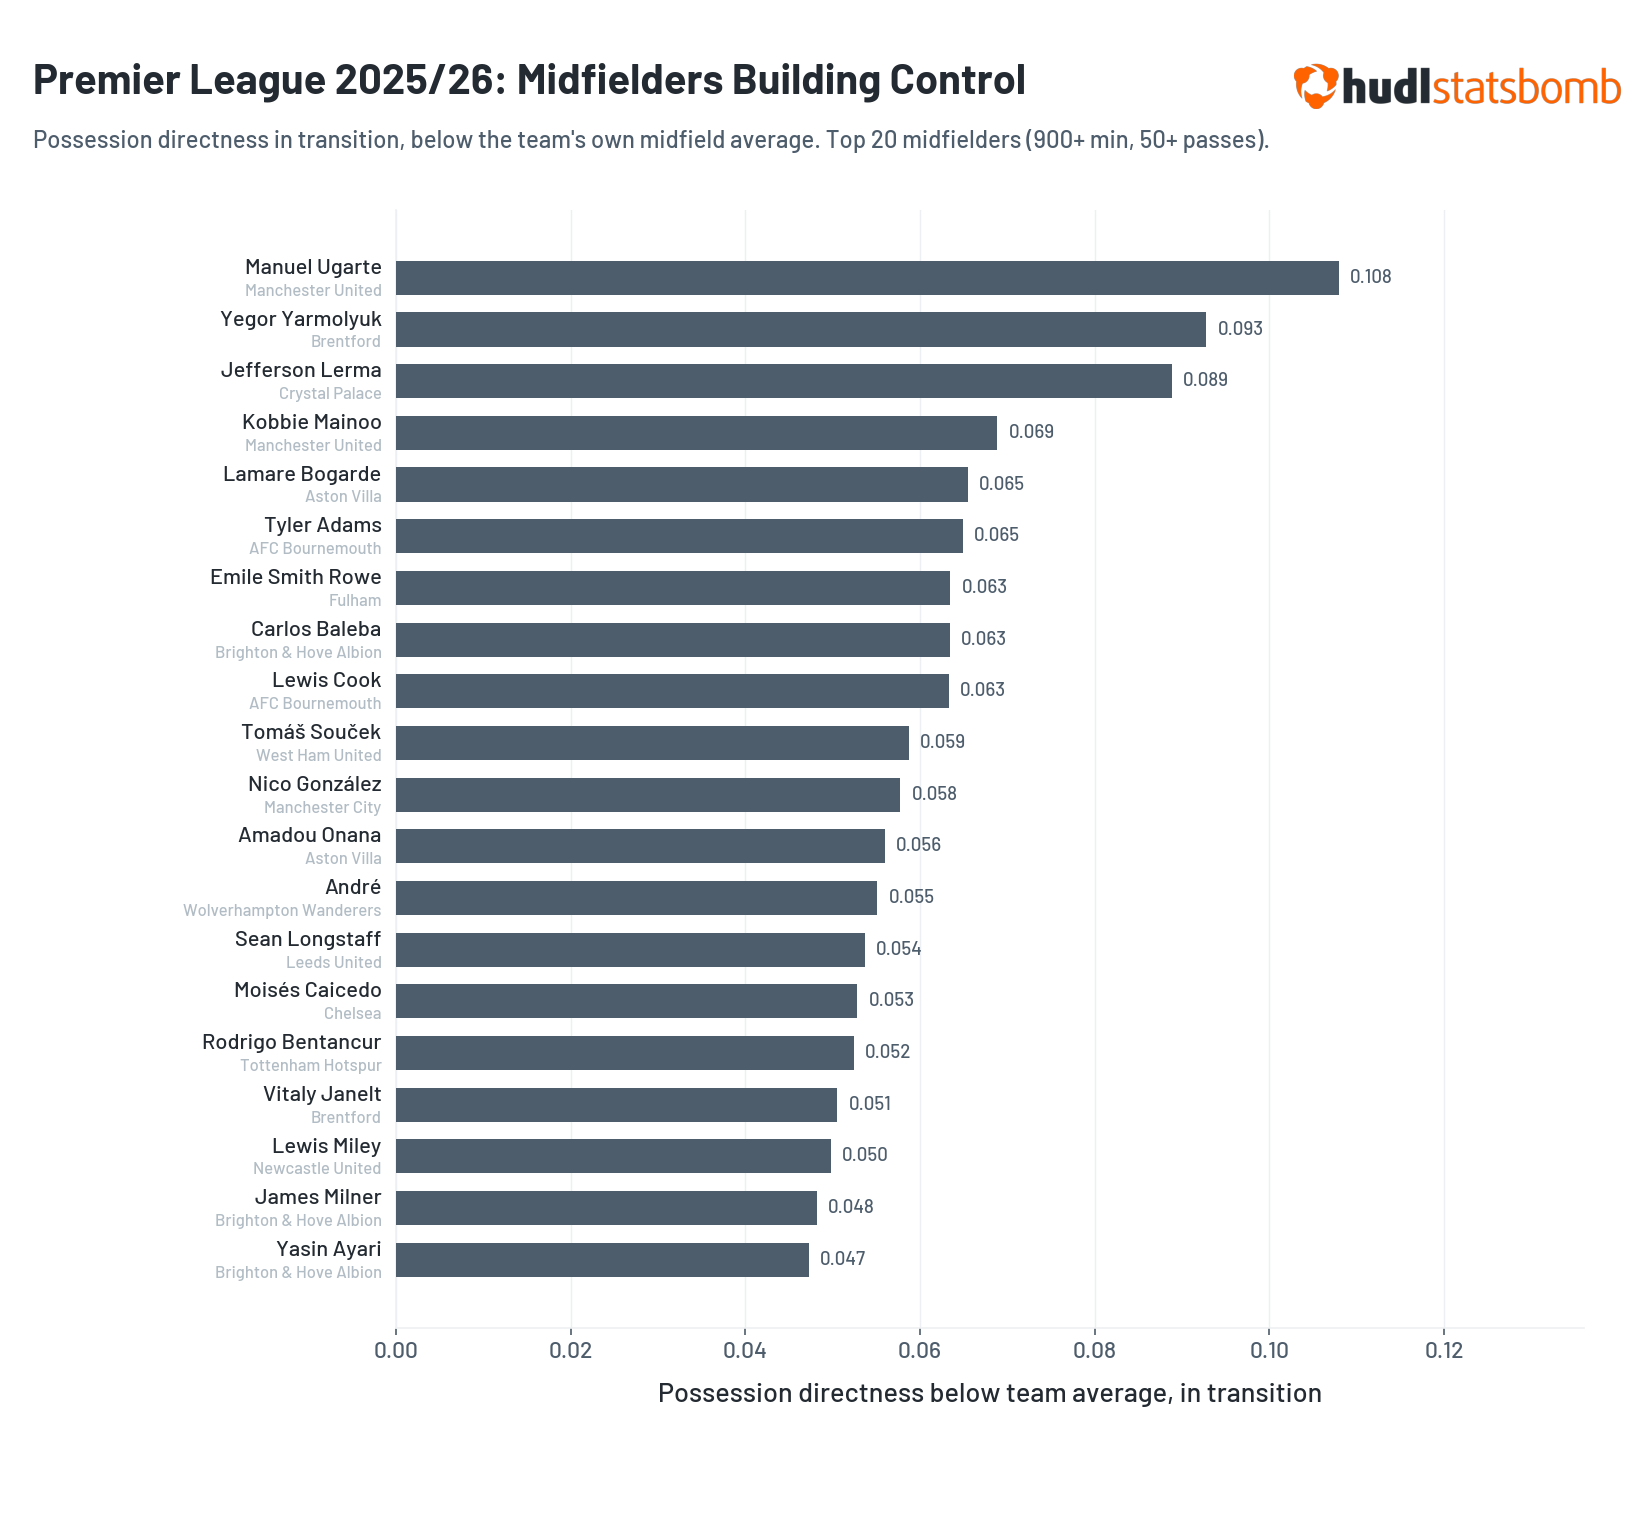
Manuel Ugarte leads this group by some distance, his directness in transition sitting 0.108 below Manchester United's midfield average. Yegor Yarmolyuk and Jefferson Lerma follow – both clear profiles of midfielders who absorb pressure and slow the game down when the team is unsettled.
For sides that struggle to manage transitions and need a midfielder who prioritises stability over speed, this chart identifies candidates that volume metrics alone would not surface.
The opposite profile – midfielders who arrive in transition and immediately accelerate play – is equally specific.
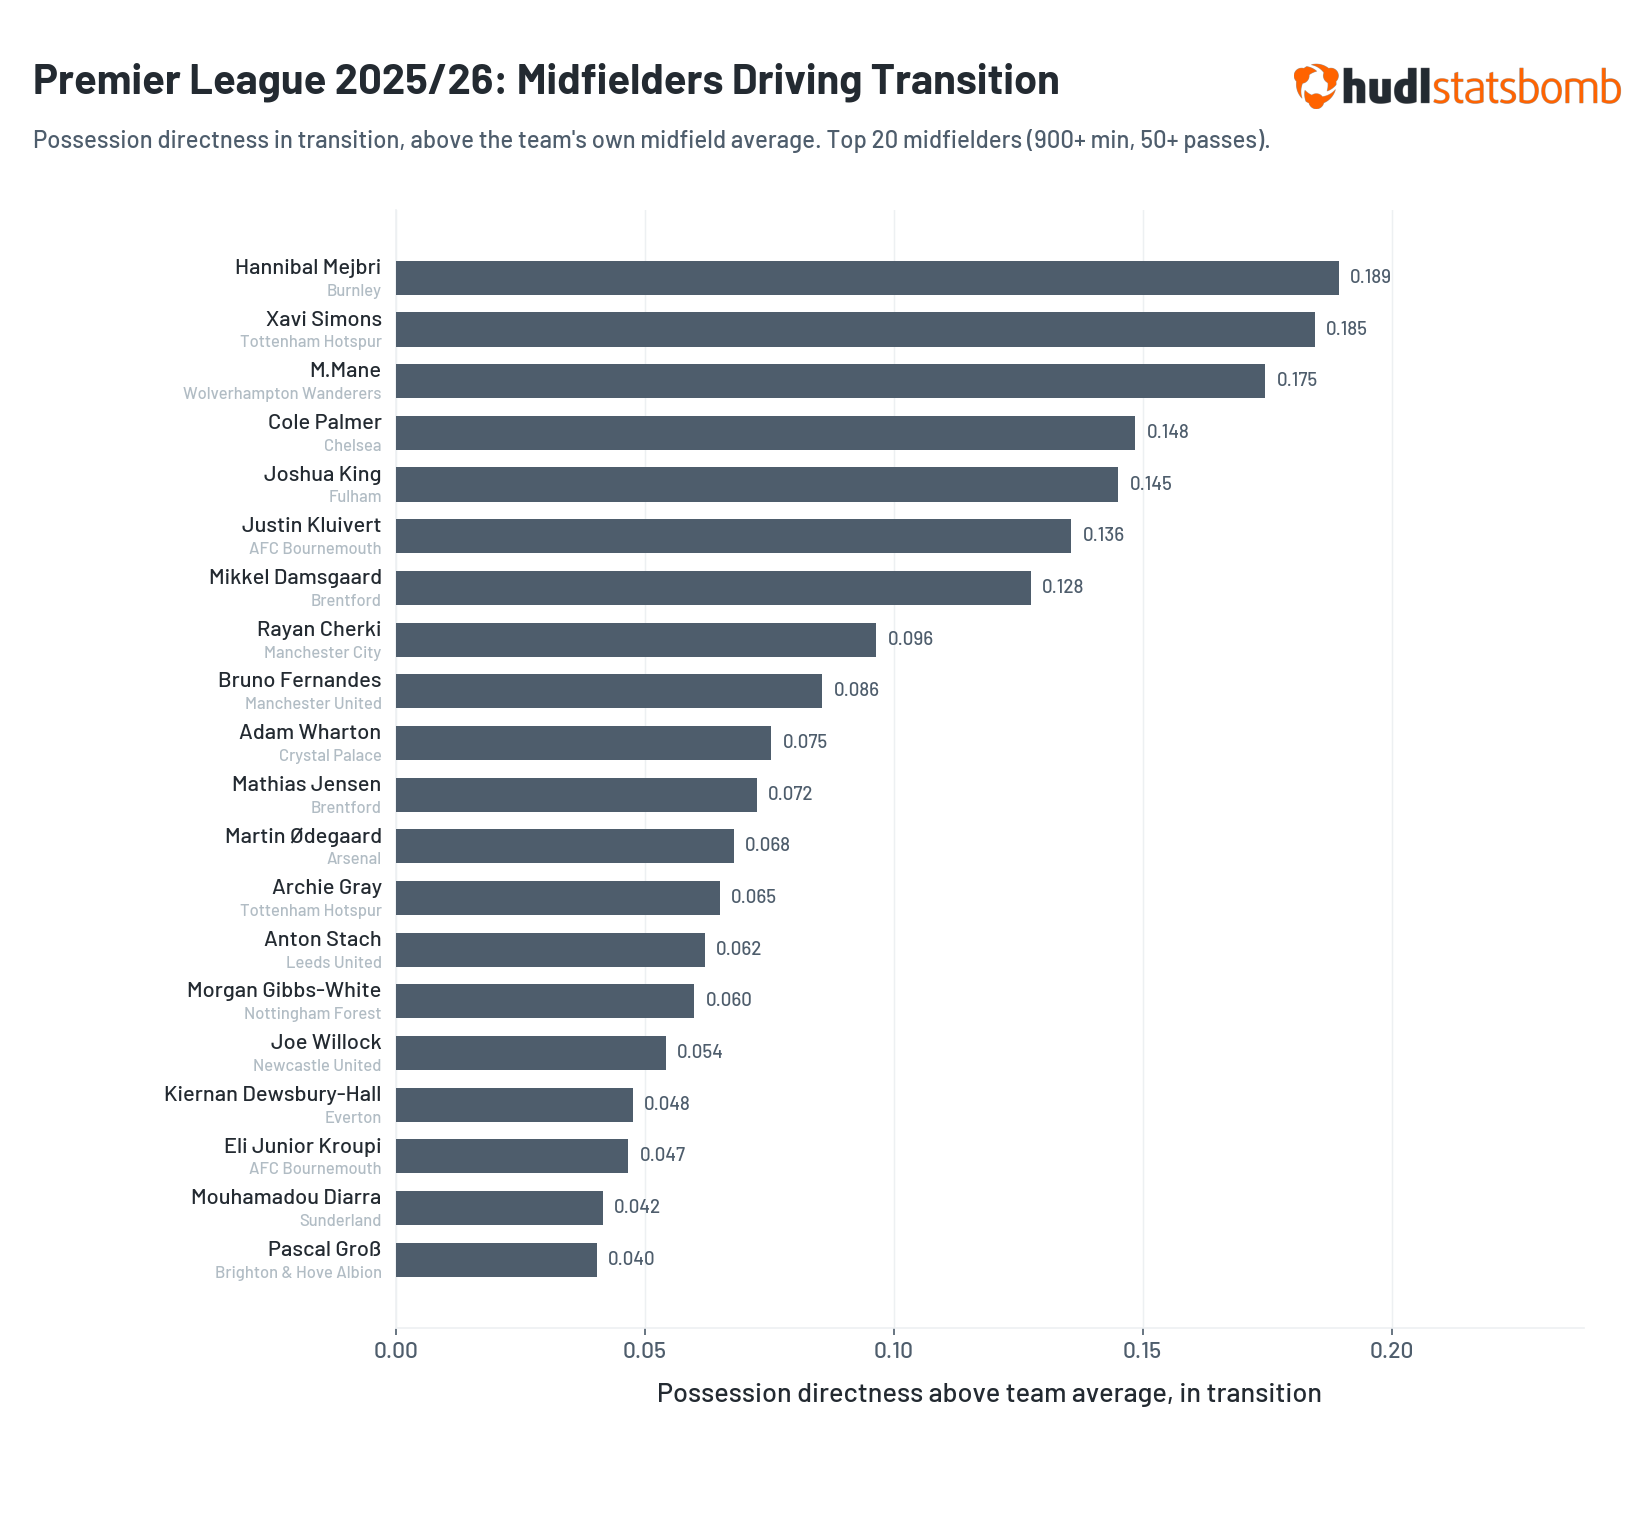
Hannibal Mejbri leads at 0.189 above Burnley's midfield average – a player who consistently accelerates possessions in transition rather than slowing them. Xavi Simons, Mateus Mane and Cole Palmer follow, profiles of attack-minded midfielders who want the ball in unstable moments and use it to hurt teams immediately.
A club that needs a midfielder to settle transitions and a club that needs one to drive them are asking completely different questions. Until now, the data struggled to capture this nuance so succinctly.
Having identified how players contribute to transitions, we can also look to gain an understanding of how these transitions start and end. For example, who initiates transitions through winning the ball back for their team? And what are the outcomes of these transitions?
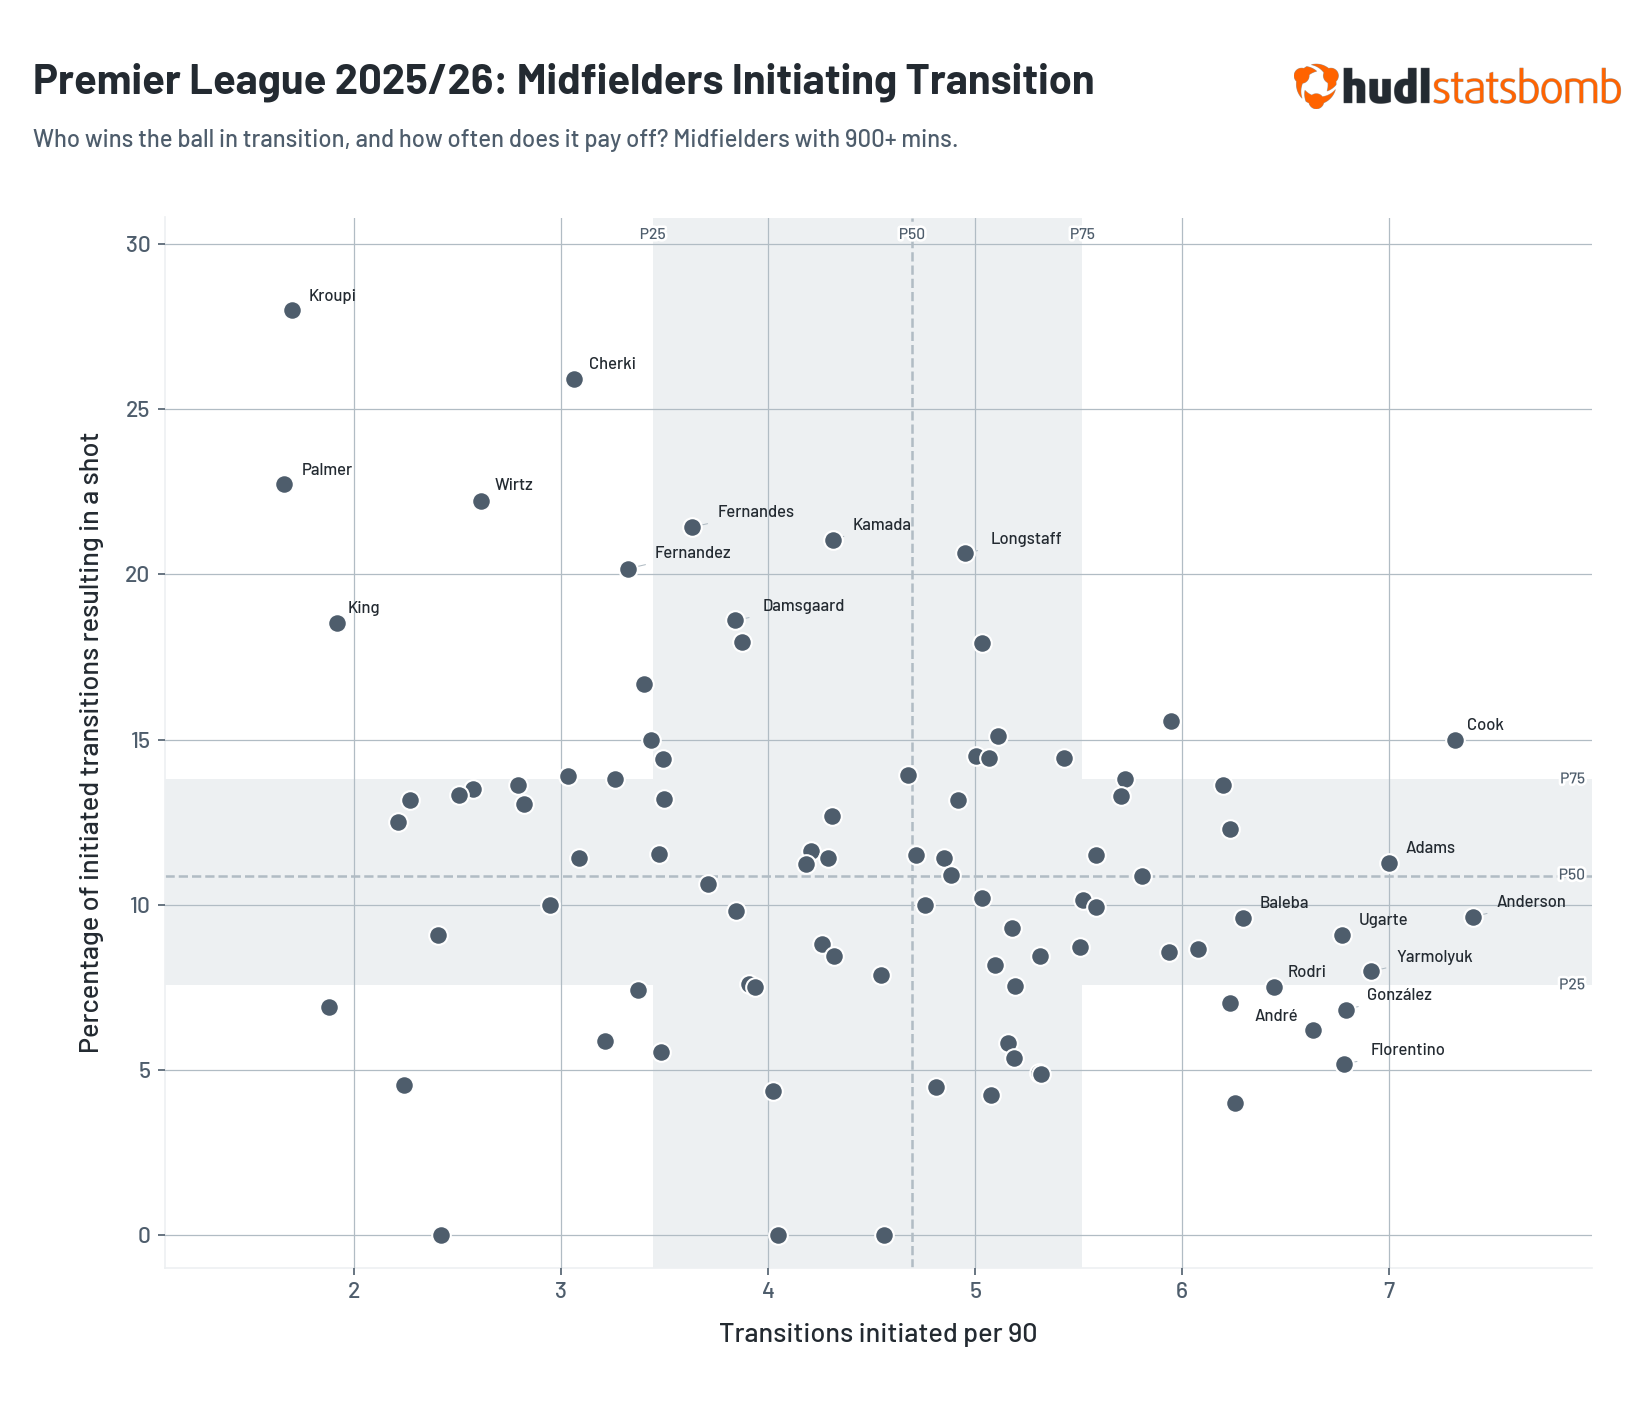
The scatter brings both dimensions together, plotting transitions initiated per 90 against the percentage that result in a shot. Whilst Eli Junior Kroupi, Cole Palmer and Rayan Cherki initiate a lower volume of transitions, a high proportion of these result in a shot, suggesting that they win the ball back high up the pitch — selective, and dangerous when they commit.
In comparison, Elliott Anderson, Tyler Adams and Lewis Cook sit in the high-volume, above-average conversion cluster: the kind of profiles that make a press-heavy system function because they not only win the ball, but immediately do something with it.
For a recruitment analyst, the quadrant matters as much as the number. It tells you not just what a midfielder produces, but how — and whether that fits the specific demands of your system.
What comes next?
Phases of Play is available now in the Hudl Statsbomb API, across more than 200 competitions. If you are already working with our event data, the context is there — ready to enhance the depth and speed of your analysis workflows.
In the coming season, Phases of Play will be available across the Hudl Pro Suite and linked to video across Sportscode, Insight, and the Hudl Statsbomb platform. This will give analysts the ability to move directly from a data insight to the video that validates it.
Full documentation is available via the Hudl Statsbomb Datahub. For any questions, reach out to Hudl Support or your account executive.