How Colgate Women's Hockey Turned Data into Dominance


See how the Raiders use hockey analytics to turn a 56% possession rate into an 88% win rate with Hudl Instat.
It’s late February. The rink is freezing. You sit on the bench and glance up at the scoreboard, you’re down by a goal with two minutes left in the third. From the bench, you’re making split-second decisions based on what you think you see.
You trust your gut. You’ve been coaching for 20 years. You know who’s skating hard and who’s floating.
But what if your gut is wrong? Okay, maybe not wrong per se, maybe just biased.
Relying solely on a “gut feeling” or "eye test" is like trying to win a faceoff with a broken stick. You might get lucky once, but over the course of a season, you’re going to get beat.
We’re seeing a massive shift in how the best teams operate, from DI programs down to local youth clubs. It’s no longer about who yells the loudest in the locker room. It’s about who can translate what happens on the ice into actionable insights faster than the opponent.
This isn't just theory. It's exactly how the Colgate University women's hockey program turned a philosophy into a mathematical formula for winning. And it didn't start with a Hall of Fame player behind the bench—it started with a guy who will be the first to tell you he never even laced up skates for a game.
An Outsider’s Edge
Ryan Kearney, formerly Colgate’s Director of Hockey Operations and now with the University of Minnesota, is brutally honest about his playing resume.
“I actually never played hockey,” Kearney says. “So don't even ask me to be on your beer league team. You don't want me there.”
But that lack of "gut feeling" derived from playing experience actually became an asset. He didn't have biases; he had data. When he joined the staff, he needed to use hockey analytics to prove that the team’s identity wasn’t just a vibe—it was a measurable reality.
In a sport obsessed with "culture" and "identity," Colgate wanted to prove that their style of play wasn't just a philosophy—it was a math problem with a solvable answer. And they found it using ice hockey software that transformed their gut feelings into cold, hard facts.
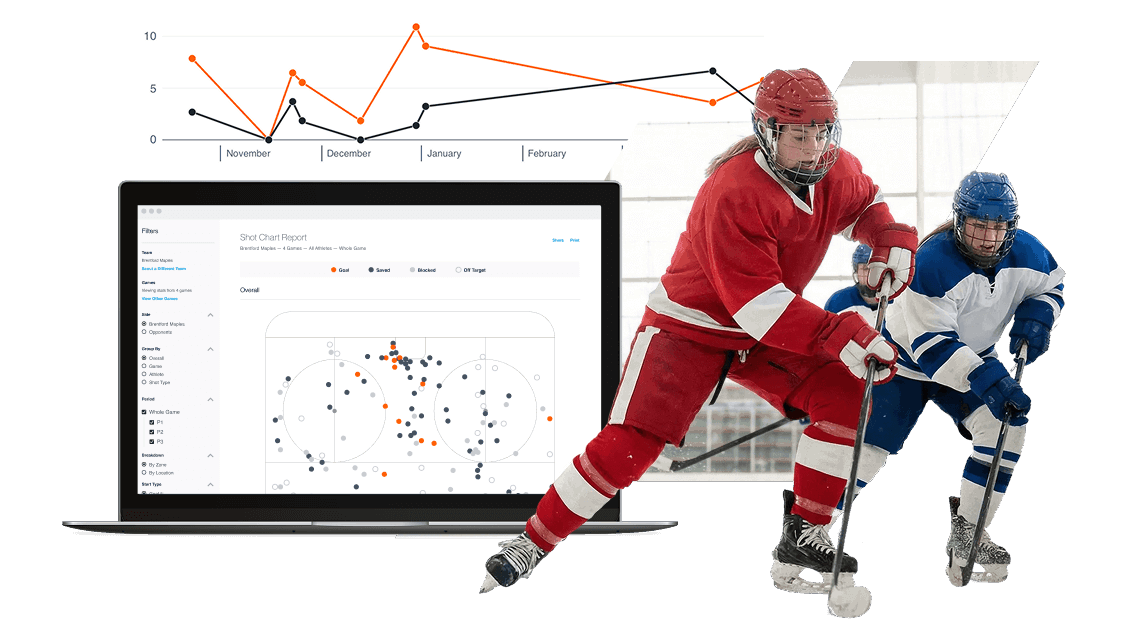
The Magic Number: 56%
Every coach preaches possession. It’s the oldest cliché in the book: “If we have the puck, they can’t score.” Colgate’s coaches preached it constantly in the locker room and in practice planning.
But Kearney used ice hockey software to stop guessing and start knowing. He dug into the Hudl Instat data to find the specific correlation between possession time and wins.
He found a number that changed everything.
“We found that, at games when we were possessing the puck at even strength over 56 percent, that that was drastically improving our win percentage,” Kearney explains.
The results were staggering. When Colgate hit that 56 percent mark, they won almost 88 percent of their games.
This moved the conversation from “I think we played well” to “Did we hit our number?” It validated the coaching staff’s strategy and gave the players a tangible target. As Kearney puts it, “The analytics, they'll tell that story for you.”
Stealing from the Gridiron
Innovation often happens when you look outside your own sport. Before his time in hockey, Kearney volunteered with the University of Iowa football team.
He watched how defensive coaches tracked "explosive plays" (plays over 20 yards). The football staff realized that limiting opponents to two or fewer explosive plays directly correlated to winning games.
Kearney took that concept and brought it to the ice, creating a "Game Log" to track trends in wins (highlighted green) versus losses (highlighted red).
“I kind of got this idea from football,” Kearney admits. “How can we look at the trends of what we're doing in our wins and our losses and see what we can get out of that kind of a situation?”
By tracking these trends over a season using hockey video analysis software, the staff could see beyond the score. Was the goalie’s save percentage low, or did they give up too many high-danger chances? The Game Log removed the emotion and focused on the facts.