NFL Draft 2025: Evaluating the Quarterbacks With Hudl IQ


In last year’s draft, six quarterbacks were taken in the first round, tying the famed 1983 class headlined by John Elway and Dan Marino for most in NFL draft history.
The 2024 class has a long way to go to catch up to the accolades of that '83 class, but they got off to a promising start in their first season. Jayden Daniels won Offensive Rookie of the Year, went to the Pro Bowl, and took the Commanders back to the playoffs. The Commanders won a playoff game for the first time in almost 20 years, before falling in the NFC title game to the eventual Super Bowl Champion Philadelphia Eagles. Bo Nix also had a strong rookie year for the Broncos, helping them win 10 games and earning a Pro Bowl nod.
It was a mixed bag for other members of the rookie class, though. Top overall pick Caleb Williams and the Bears struggled with pressure and sacks. Drake Maye and Michael Penix both started the season on the bench, taking over midway through their teams' campaigns. They each had promising moments, but the jury is still out on future success. The other first-round quarterback, JJ McCarthy, suffered a season-ending injury in the preseason, but signs point to him being the starter for the Vikings this season.
With the success of several rookie QBs, on top of CJ Stroud’s standout ‘23 season, the upcoming class feels like a step back in terms of immediate impact. Right now, Cam Ward, Shedeur Sanders, and Jaxson Dart are the only quarterbacks projected to go in the first round. While each brings intriguing upside, they also come with significant question marks that keep them from being considered surefire prospects.
Hudl IQ provides access to data you won’t find anywhere else, especially when it comes to evaluating quarterback play. And when it comes to evaluating quarterbacks, there’s one stat in particular that helps us dig into one of the most critical aspects of their game—accuracy.


This graph compares two completion probability values for each quarterback: one that includes pass location, and one that doesn’t. Each dot represents a full college season. Blue dots mark the college seasons of QBs currently in the NFL, while orange dots represent the last two seasons for the top QBs in the upcoming draft. We’ve highlighted key names and seasons to help tell the story.
If a quarterback falls to the right of the line, it means their pass placement is increasing the likelihood of a completion. If they fall to the left, their ball placement is actually making completions harder.
Let’s start with the QBs now in the NFL. Caleb Williams landed to the left of the line in both of his final college seasons, though he showed a significant jump in completion probability from 2022 to 2023.
Jayden Daniels stayed steady in completion probability with placement, but saw a drop in the version without placement—moving him from the left side of the line in 2022 to the right side in 2023. Then there’s Bo Nix, who stood out with elite values in both categories—he was the clear completion probability king last season.
Now, let’s look at the next wave. Cam Ward is on track to be the second straight projected No. 1 overall pick whose pass placement actually reduces the chance of a completion. His numbers declined in both models from 2023 to 2024. Facing tougher competition may explain some of the drop-off, but it’s still noteworthy.
Shedeur Sanders followed a similar trend to Daniels—his completion probability without pass location dropped year-over-year, while his with location value held steady. Importantly, he lands to the right of the line in both years, meaning his placement consistently boosts completion chances.
Jaxson Dart has shown steady growth from 2022 through 2024, with a noticeable leap in completion probability thanks to improved pass placement this past season.
Another quote from Walsh in Finding the Winning Edge:
“The fundamental goal of passing a ball is to make sure it’s caught…by the intended receiver.”
A quarterback can’t control dropped passes, defensive schemes, or blown protection—but they can control where the ball is placed. And that placement has a major impact on whether the pass is completed. This graph makes it clear which quarterbacks are helping—or hurting—their chances based on accuracy alone.
Pocket Movement
Another key metric for Bill Walsh is how well a quarterback moves. Can they move around in the pocket to avoid rushers? Do they throw the ball well on the run? Can they make a play with their feet when they need to? Let’s use some more Hudl IQ tracking data to see how the top 3 move.
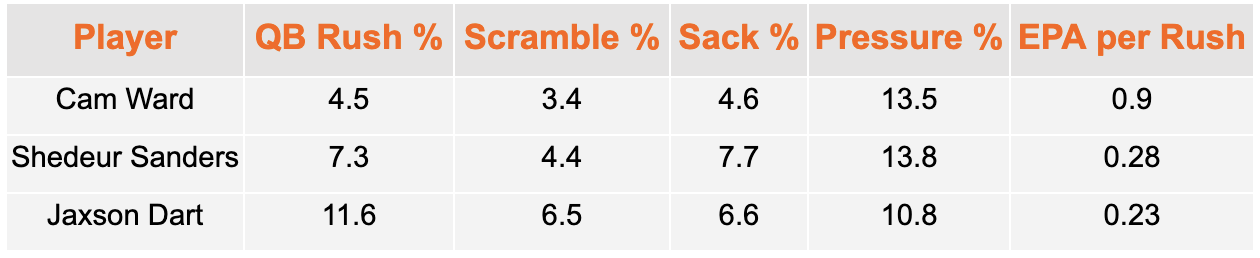
This is one area where Cam Ward really separates himself from the other top QB prospects. Despite facing a high pressure rate, his sack rate remains low—a strong indicator of his ability to navigate the pocket and avoid negative plays. The pressure-to-sack ratio is one of the more stable traits that translates from college to the NFL, making this a big mark in his favor.
Ward also has a low rush and scramble rate, meaning he prefers to stay in the pocket and deliver the ball—another plus for teams looking for a poised passer. But when he does take off, he’s incredibly effective. His 0.9 EPA per rush was the best in the country among QBs last season. He’s not just mobile—he’s a true playmaker when the situation calls for it.
On the other end of the spectrum is Jaxson Dart. He’s far more likely to use his legs, both on designed runs and scrambles. However, his low EPA per rush in those situations is a potential red flag. Combine that with the lowest pressure-to-sack ratio among the top prospects, and it suggests he’s more likely to turn pressure into negative plays.
So far, we’ve looked at traditional stats to evaluate pocket movement. But thanks to Hudl IQ’s tracking data, we can take it a step further.
The plot below shows each QB’s passing attempts from the pocket last season. The orange dot marks where the QB received the snap, and the vertical blue line helps visualize whether throws were made from the left or right of that initial position—giving us a more detailed picture of how each quarterback moves within the pocket.


Why Hudl IQ Matters in Evaluating QBs
Quarterback is not only the most important position in football—it may be the most important in all of sports. And yet, even with all the emphasis placed on finding the right one, the hit rate for QBs in the draft still hovers around 50%.
That’s why teams are constantly searching for new ways to close the gap—looking for fresh data points, advanced models, and anything that can offer an edge.
Hudl IQ provides insights no other platform can. From granular accuracy metrics to tracking-based pocket movement, this data brings another dimension to QB evaluation—helping decision-makers go beyond the box score and see the full picture.
Each of these top prospects brings unique strengths and weaknesses. Hudl IQ helps surface them all.


