USA vs Tonga: Tackle Sequences and Attack Width the Key to Victory
16 Oct 2019
3 min Read
By Tony Sprangers
Analysis point 1: Width of attack and defensive pressure leads to Tongan scores.
*To begin with we will define some of the metrics used in this analysis:
A.Tackle Sequence: is the ability to a team to make tackles in succession.
B. Attack Map: Is the lateral distance from the source of possession that a target is set by the attacking team. The flatter the line on the graph, the more width and variation a team has on attack.
Tonga’s tackle sequence of 9.9 is relatively high and place defensive pressure on the Americans. (The overall average tackle sequence for the match was 7.4). This together with the territory enjoyed by Tonga is a major reason that forced the USA to start a kicking game which led to Tonga scoring 2 tries from the possession gained from receiving kicks in strong attacking positions on the pitch.
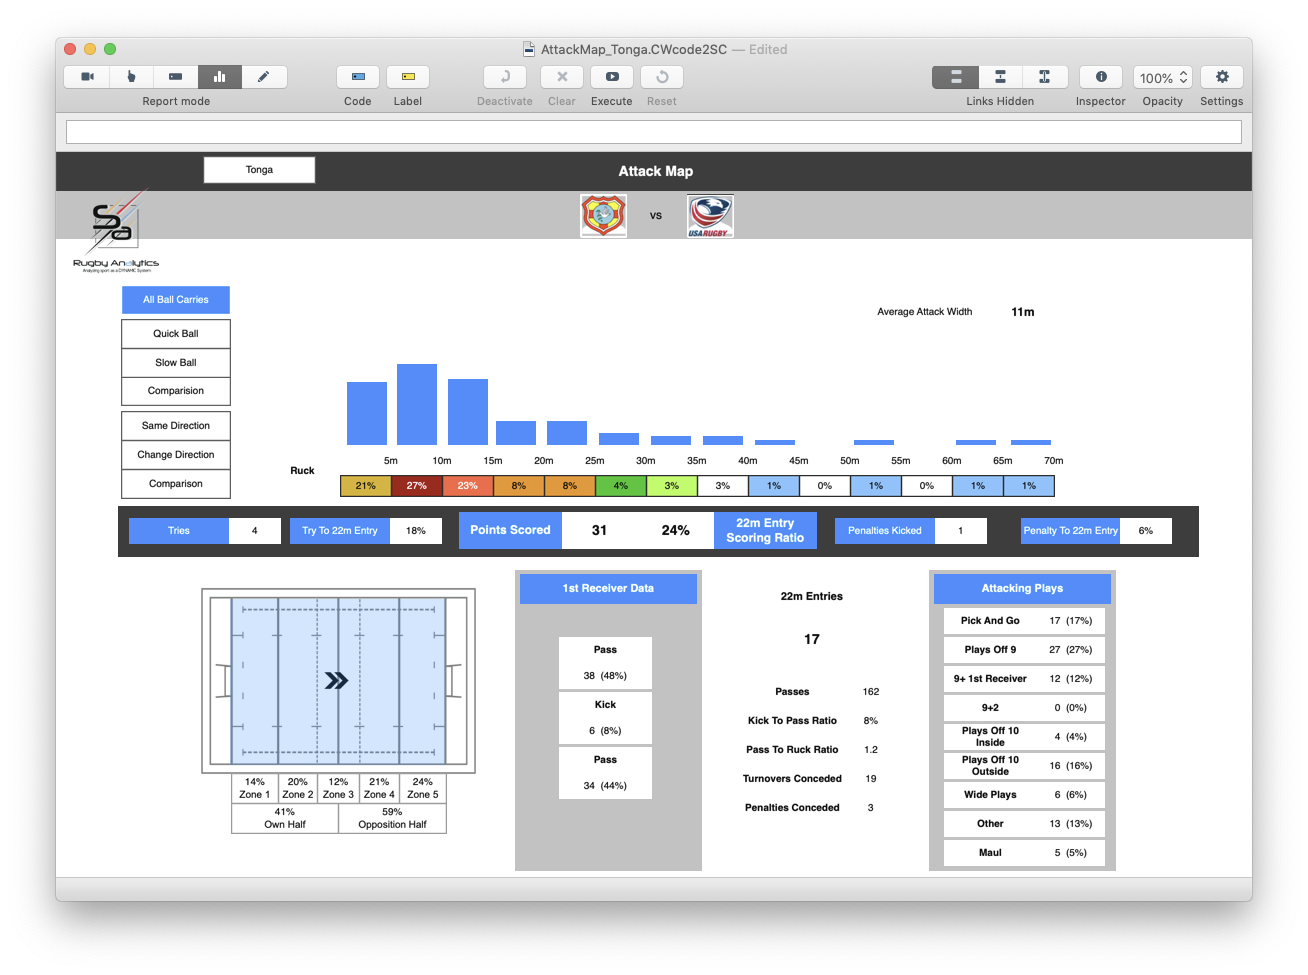
The below attack maps produced by Rugby Analytics through Hudl Sportscode show firstly Tonga shows that the average width of attack from rucks for Tonga was 11m compared to the 8m for the USA, showing Tonga created more opportunity by attacking in wider channels.
Tonga attack map showing a key a stat of wider width of attack of the ruck compared to the USA (see next image).
USA attack map showing a narrower width of attack off the ruck as well as a higher percentage of kicking the ball vs passing compared to the Tongan team.
Conversion of opportunities
USA showed an ability to score from a narrower attack setup by being able to trap between 6-7 Tongan defenders within 15m of the field and then going wide on attack. Mike Te’o's first half try in right hand corner was an example of this and the setup of play can be seen in the Hudl game analysis drawing below.
USA attack setup is narrow but having previously drawn in the defence tight through a previous lineout maul. The try was scored one phase later in the far corner.
Analysis point 3: USA losing structure and Tonga thriving in the broken field.
USA were only able to have a 35% return to play (tackler back on their feet with in 2.5sec) of their tackles Made and Tonga a 44% Return to play having made 135 successful tackles with and 89% completion rate compared to the USA’s 79% Successful Tackles with a count of 151.
USA however got lured away from their structured play and started to play more of a kicking game witch played in to the hands of Tonga handling the kicking game and unstructured counter attacking situations better than USA on the day.
Tonga capitalised on the kicking game scoring four kick involved tries, two from kick return situations and two from their own kicks. The last being a grubber from a scrum seven metes form USA Goal Line in the 81st minute of the game when fullback Telusa Veainu dotted down to seal the victory.
Ultimately one could say that Tonga stuck to their guns and kept playing the same gameplay and mixing it up between their kicking and running game with a 130 Ball Carries made in this game.
This forced USA to make 151 Tackles with a tackle sequence of 5.1. It also didn’t help them that 38% of tackles missed came form kick returns from Tonga.
Conclusion:
This match was a key example of besting an opposition by forcing them to play outside of their desired gameplan. Or at least forcing a team to play to the opposition strengths. On a base level, Tonga's high tackle sequence forced USA into pressure situations and have to kick more than would have wanted, which in turn allowed Tonga to counter from broken field situations off the kick return.
Even though USA's conversion percentage in scoring when entering Tonga's 22 was higher, the ability to counter attack made sure Tonga could mount attacks from range.
Strong Tongan defence pinning the USA deep and brilliance in broken play brought home the win on this day.
To learn more about how Hudl is powering the modern game click here, or check out our rugby case studies from French Top 14 rugby side Stade Rochelais and Premiership Rugby's Leicester Tigers.
Browse more articles in Hudl's Analysis of the Rugby World CupView the series