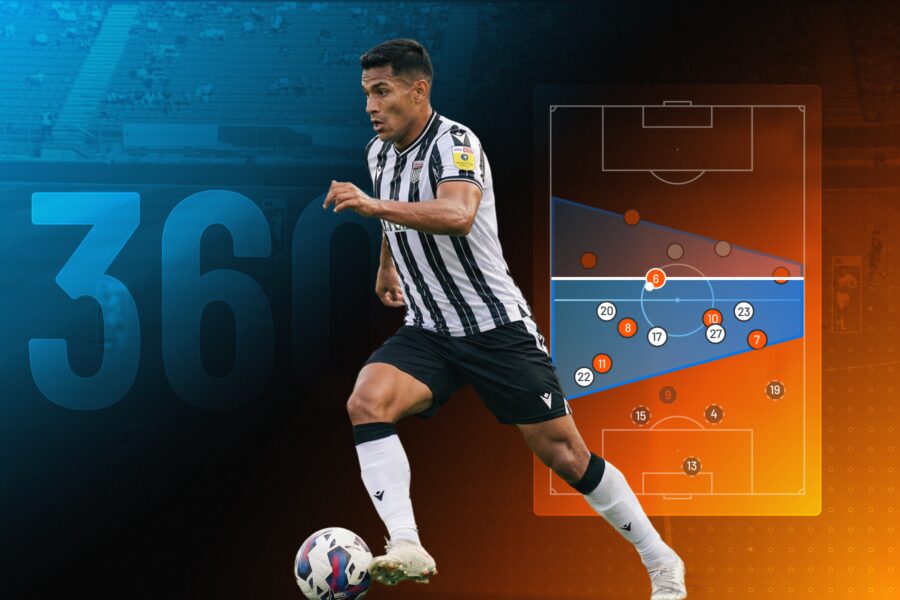
Our AI-powered models now enhance Statsbomb 360 frames, putting a name to the players around on-ball events.
Statsbomb 360 captures a snapshot of player positions at the moment of each on-ball event. Introduced in 2021, it was designed to further contextualise standard event data and derive new metrics. Event data plus, if you will.
From today, those snapshots don't just show where players are. They show who they are.
As part of our wider work to align our datasets and improve your analysis workflows, our AI-powered models now enhance each 360 frame, identifying the players around nearly every on-ball event.
The result is a fuller view of the pitch around every pass, carry and shot, with every player identified and linked to the event data you already use, no manual matching required. That opens up a whole new layer of tactical analysis, from who holds the line when the ball is lost to who attacks each zone at a corner. Here are two examples.
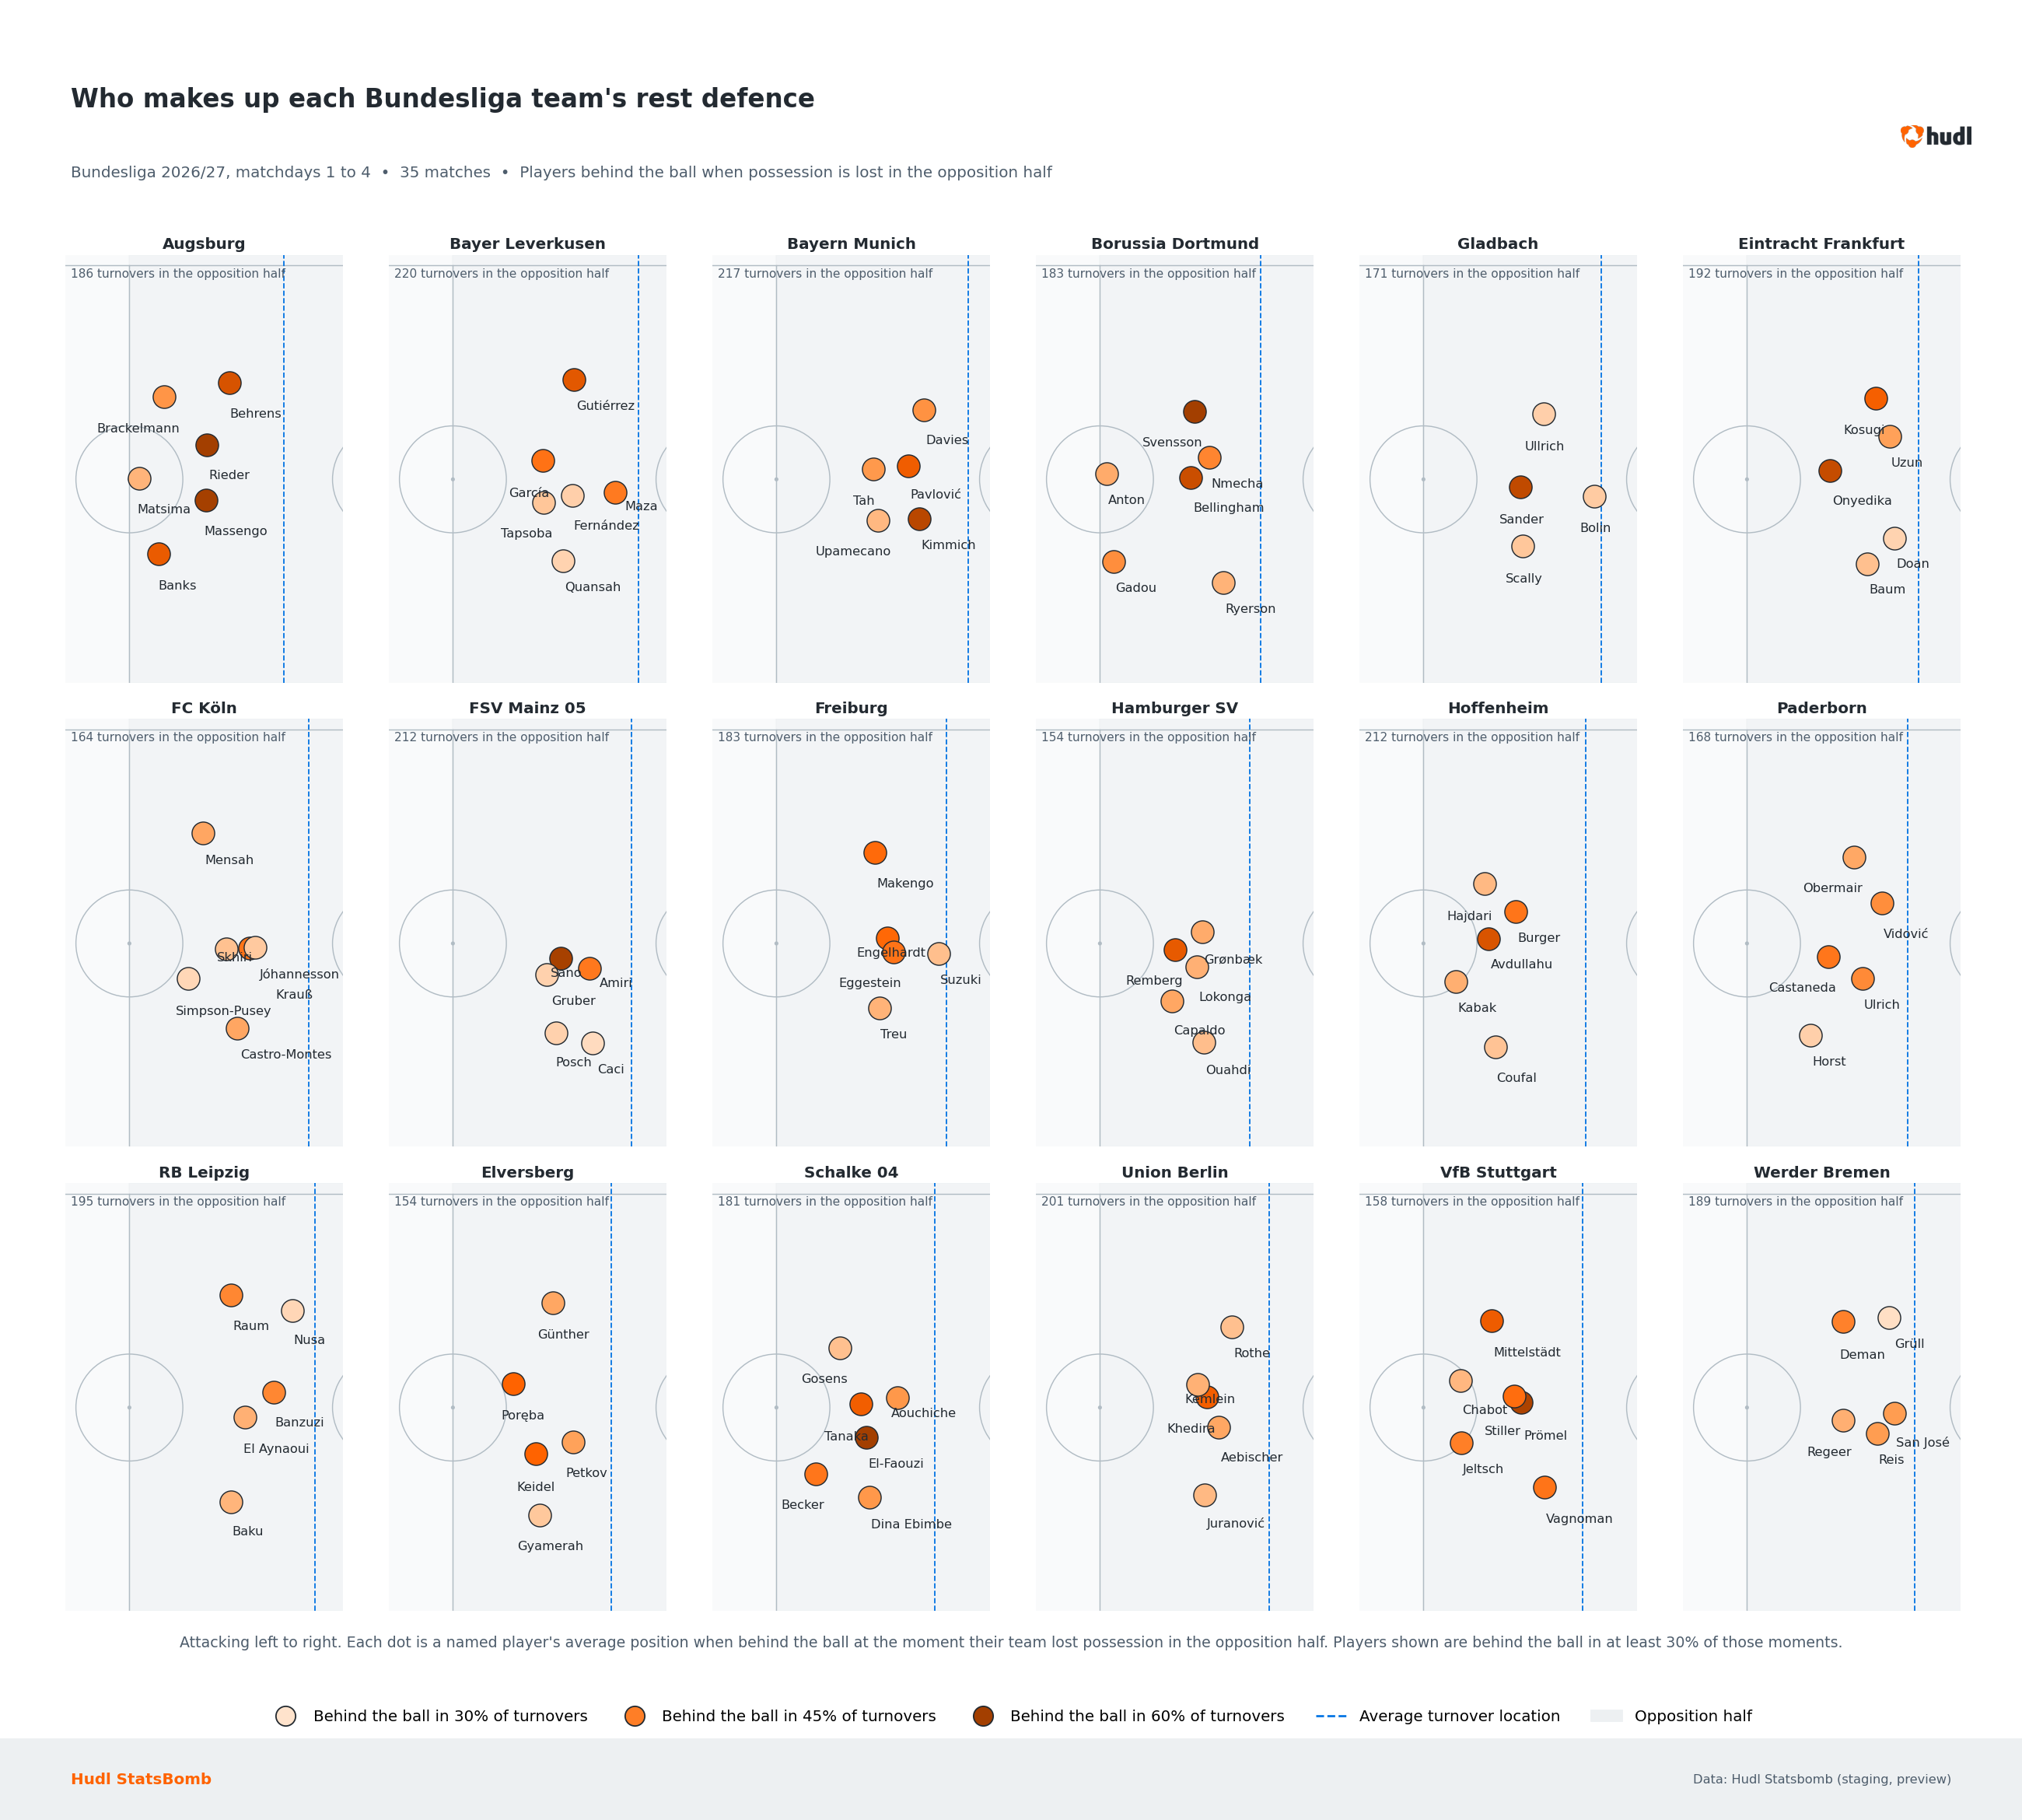
Rest defence across the Bundesliga
Rest defence is a foundational pillar of modern coaching. It refers to the group of players a team keeps behind the ball while it attacks,and plays a crucial role in maintaining balance, preventing counter-attacks, and ensuring effective counter-pressing. In common practice, most teams keep four or five players back, usually set out in two lines, such as a 2-3 or a 3-2.
However, it has always been hard to pin down with event data alone. It tells you where the ball was lost, but not who was set up behind it to stop the counter. Player ID changes that, putting a name to every player in the 360 frame at the moment possession is lost.
The chart below plots each moment this season’s Bundesliga teams lost the ball in the opposition half and shows the average position of the players behind the ball. For each team you can see the shape, the named players who make up the unit and how far from their own goal the deepest line sits.
For recruitment, this shows the job a player is asked to do without the ball. A full-back who steps inside to form a back three, or a centre-back who holds a high line when the ball is lost, needs a different profile from one in a team that sits deeper. Analysts can now see which players fill those roles at other clubs, and how often they do so, and whether the structure holds up under pressure.
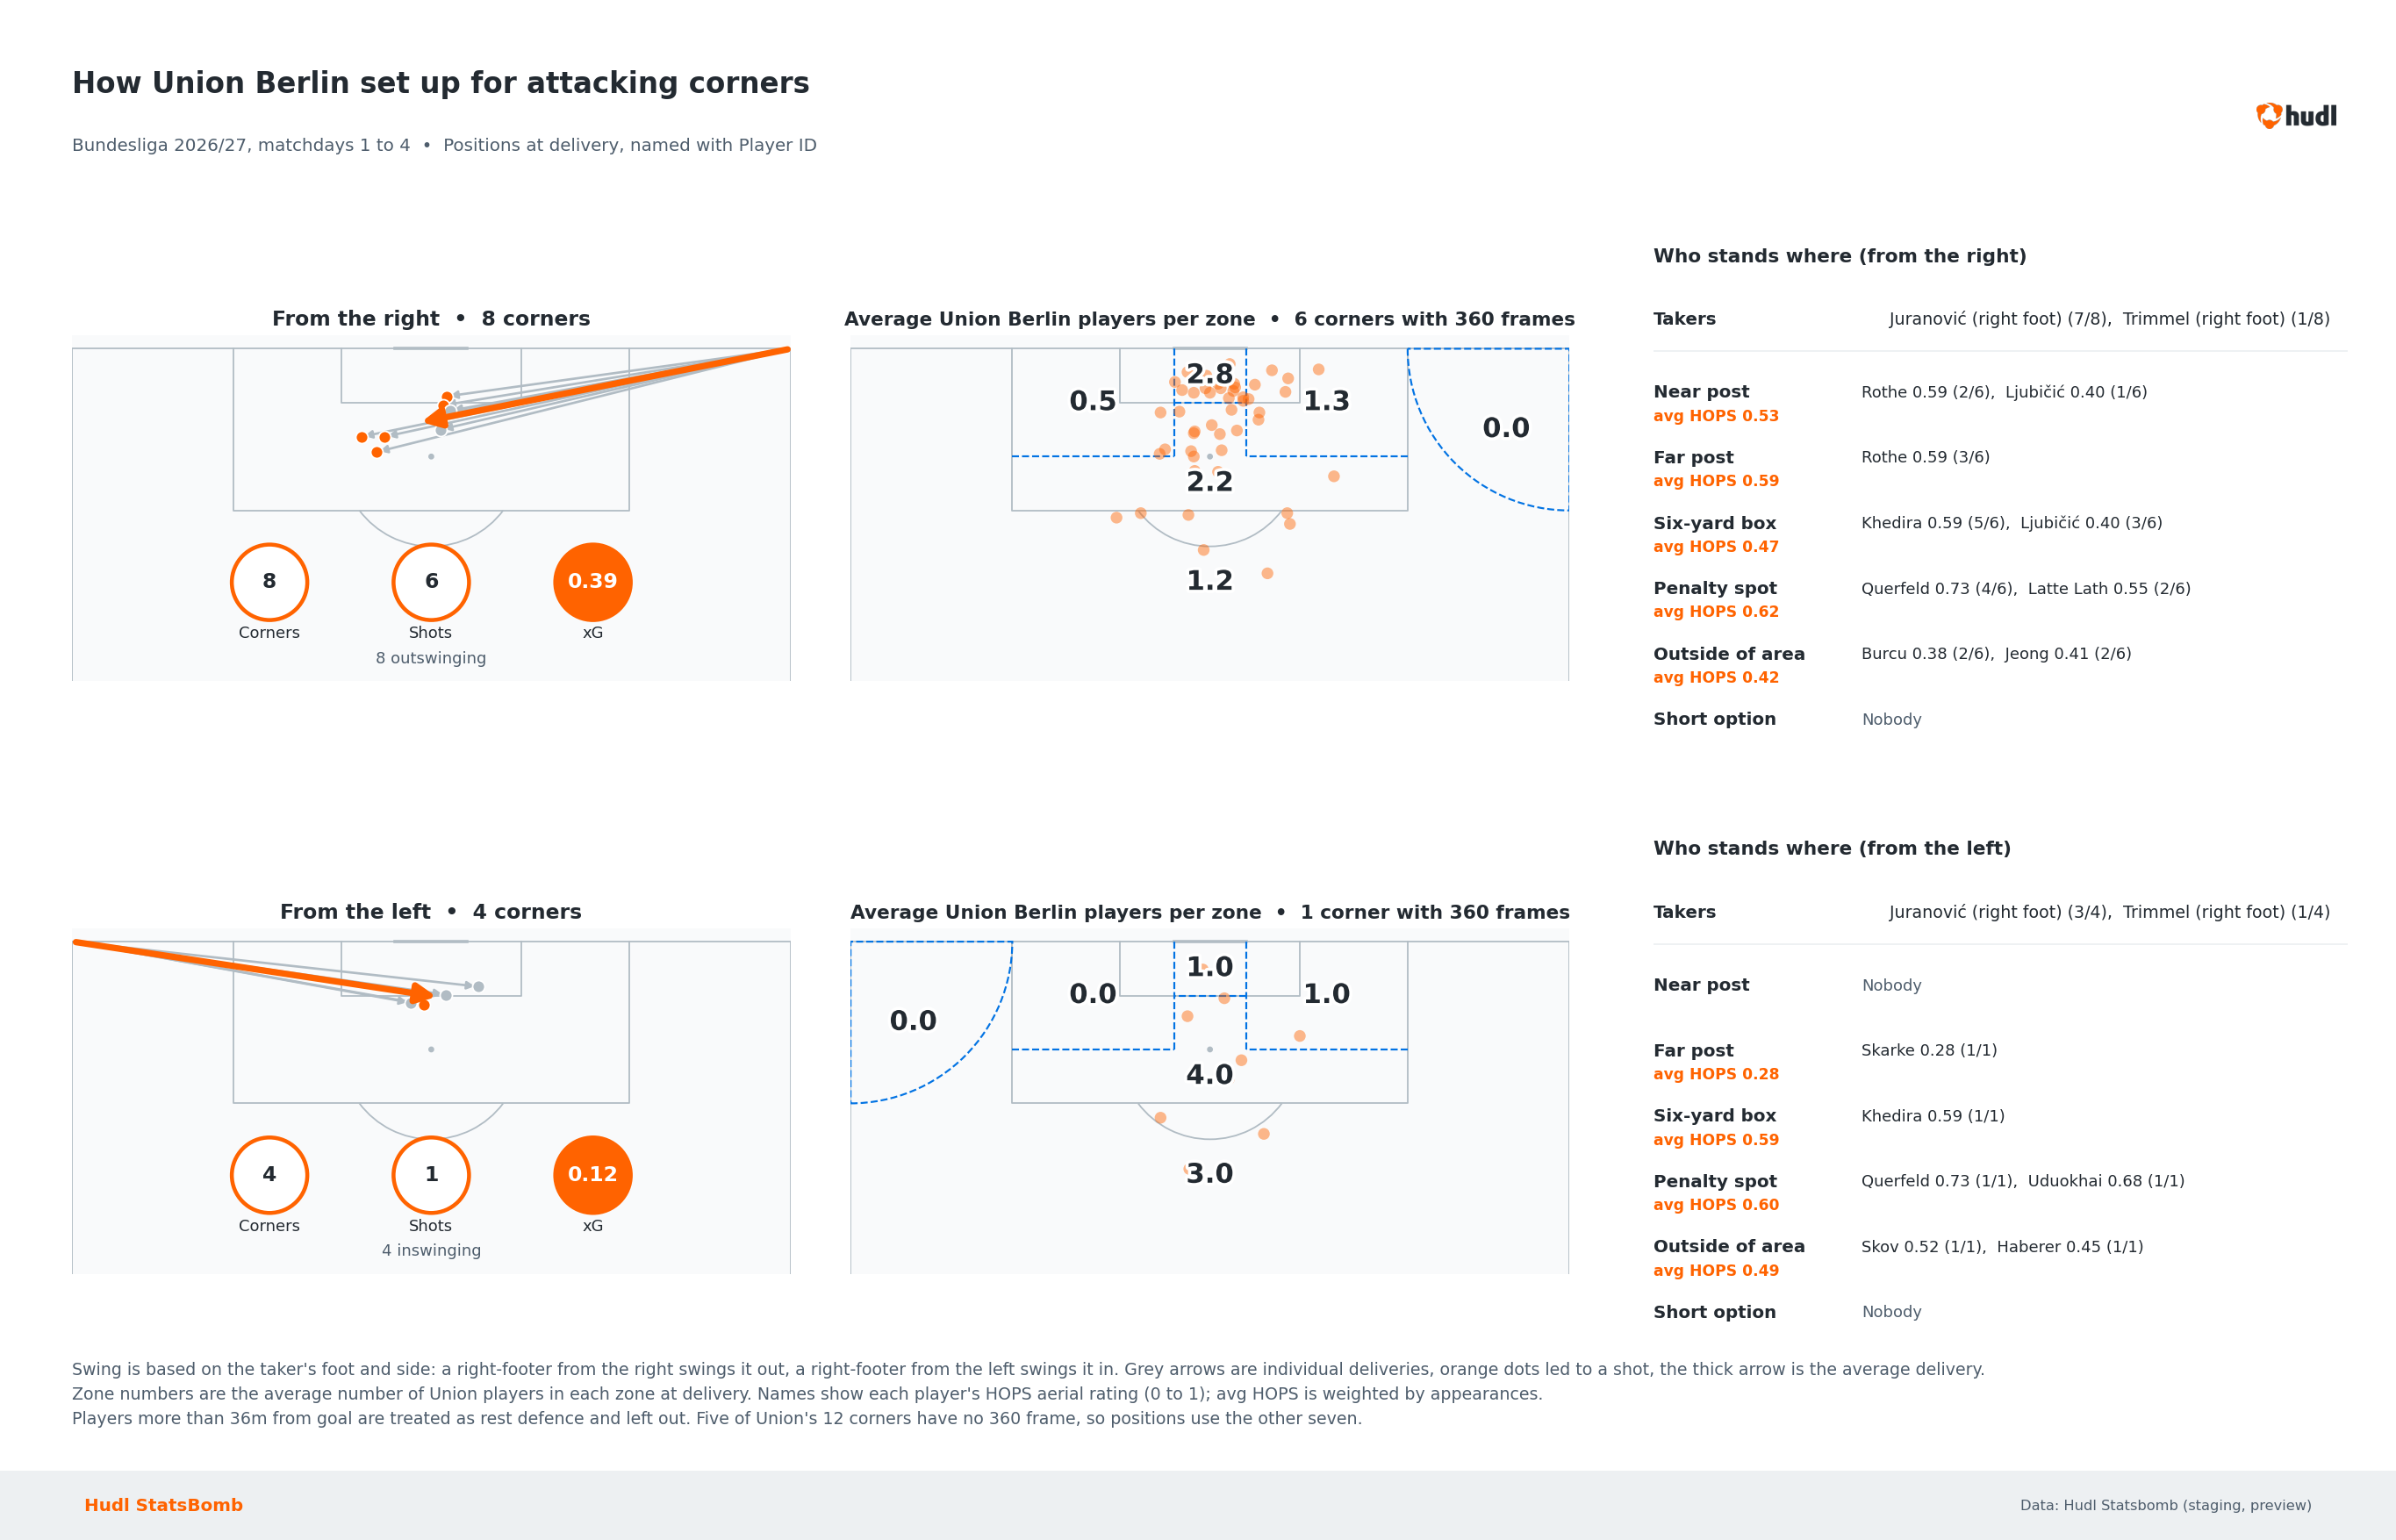
Union Berlin attacking corners
At its core, corner analysis depends on knowing who stands where. 360 frames have always shown player positions at the moment a corner is delivered, but analysts had to work out who each player was. With Player ID, every player in the frame is named.
Last season, Union Berlin created more xG from corners than any other Bundesliga side, with 0.28 per game, so they are a natural starting point for exploring what Player ID adds to set piece analysis.
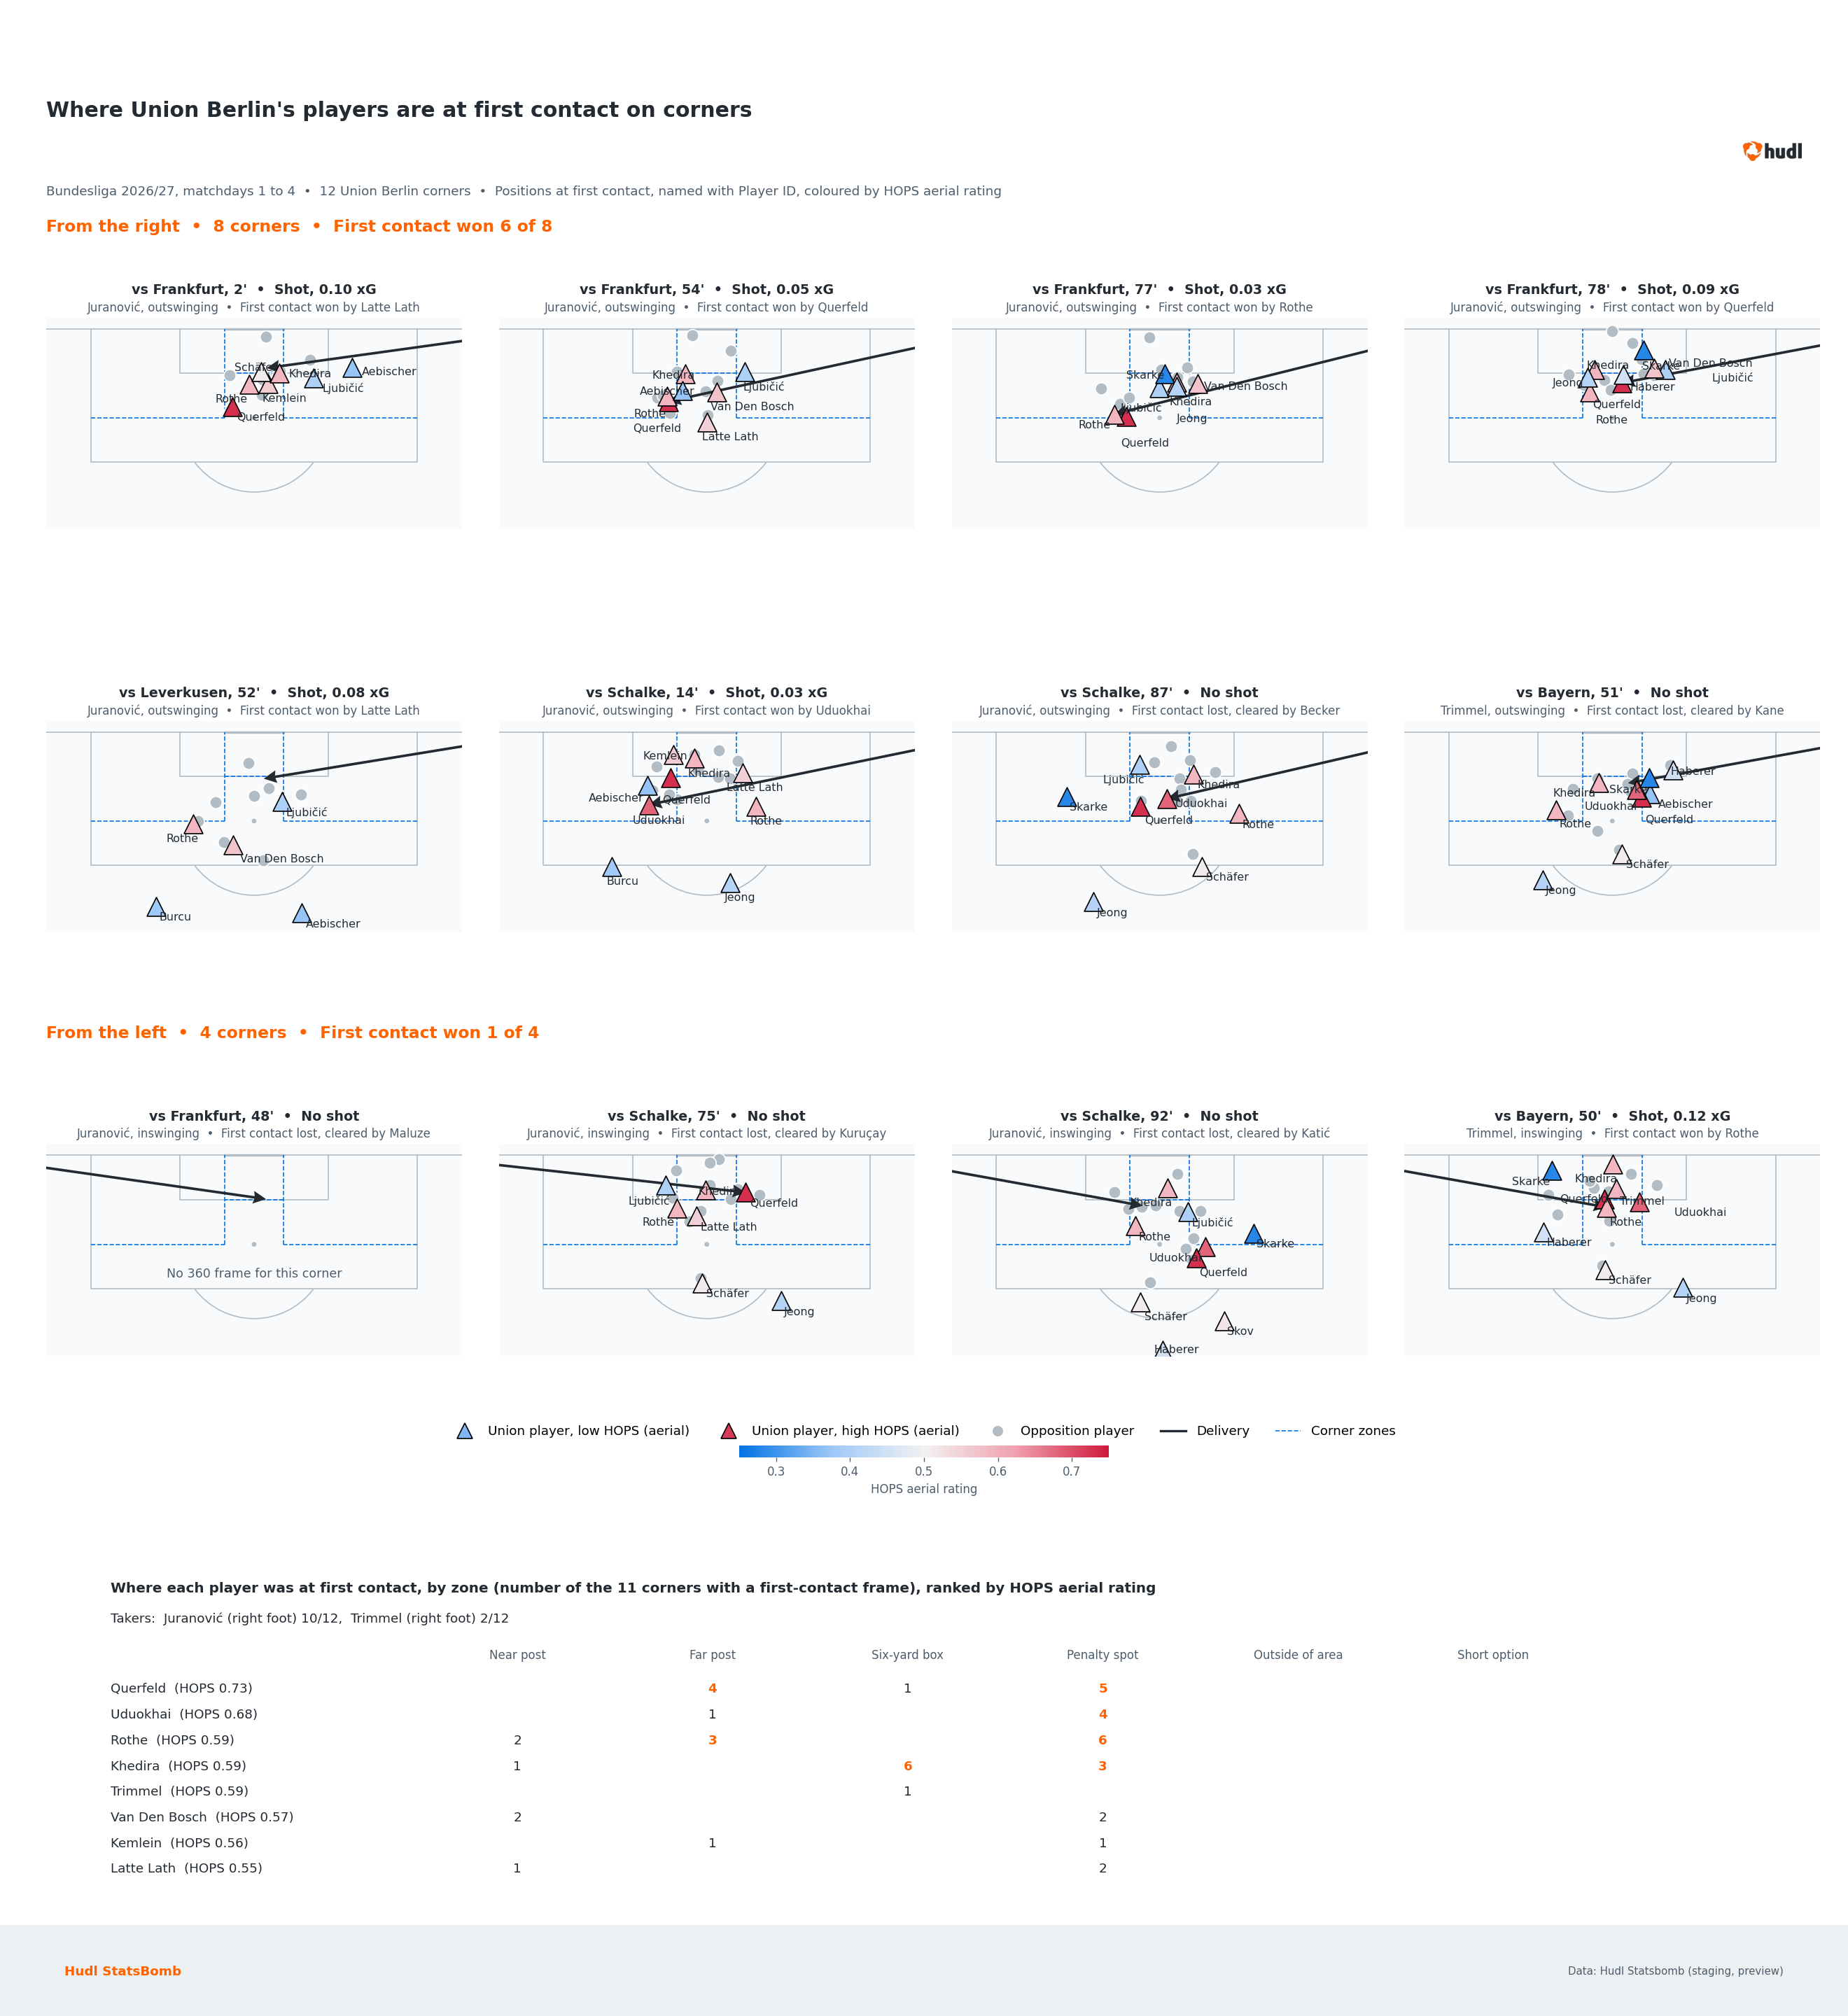
The two charts below show how they do it. The first shows how Union set up at delivery, zone by zone. The second shows where every Union player was at first contact, and whether Union won it.
Because every player is now identified, we can also bring deeper player-level metrics into the analysis too. Here, each Union player is coloured by their HOPS aerial duel rating, so you can see not just where players go, but how strong they are in the air when they get there.
For opposition analysis, you can see which players attack the near post, who stands on the goalkeeper, and who stays back, and how that changes by side and delivery type, before you face them.
Pricing and Availability
360 enhanced by Player ID is included in existing Hudl Statsbomb subscriptions at no extra cost. Delivered via API and available across 80+ competitions that have passed our quality threshold, it applies to qualifying matches from 1st August 2026.
If you have any questions about availability, contact our support team.