Measuring Availability: Instead of Nines, Let’s Count Minutes
It’s hard to find detailed explanations about how companies go about computing and tracking their availability, particularly for complex SaaS websites. Here’s how we do it for our primary web application, hudl.com.
Measuring Availability: Instead of Nines, Let’s Count Minutes
It’s hard to find detailed explanations about how companies go about computing and tracking their availability, particularly for complex SaaS websites. Here’s how we do it for our primary web application, hudl.com.
Running sites with high availability is a foregone conclusion for most businesses. Availability is pretty easy to abstractly define, but rarely explained with real examples. Most likely, the first half-dozen Google results you come across when searching about it will spend many words musing about “nines” and equating them to precise minute values and telling you just how many of these “nines” you might need. It’s harder to find more detailed explanations about how companies go about computing and tracking their availability, particularly for complex SaaS websites. Here’s how we do it for our primary web application, hudl.com.
Calculating Overall Server-Side Availability
We measure our server-side availability per-minute by aggregating access logs from our NGINX servers, which sit at the top of our application stack.
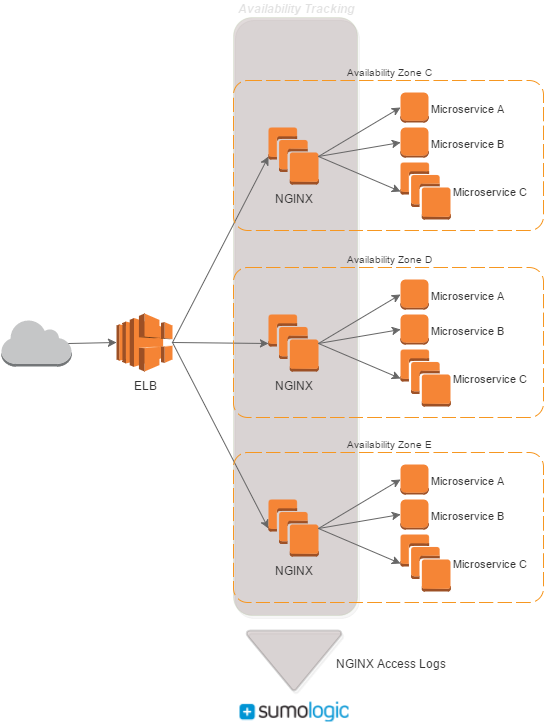
Our NGINX logs are similar to the default format, and for availability tracking we’re interested in the status code and elapsed time. We tack on some service information, which I’ll talk about in a bit.
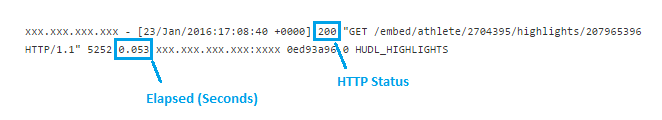
For each minute, the number of successful and failed responses are counted. A request is considered unsuccessful if we respond with a 5XX HTTP status or if it takes longer than five seconds to complete.
Each individual minute is then categorized by its percentage of successful requests:
- If less than 90% of requests succeed, the minute is considered down.
- If greater than 90%, but less than 99%, the minute is degraded.
- Otherwise (>= 99%), the minute is up.
The down/degraded/up buckets help reflect seasonality by weighting the more heavily-accessed features, and also help separate site-wide critical downtime from individual feature or service outages.
Here’s a three hour period with a brief incident — web servers in our highlights service spiked to 100% CPU for a couple minutes:
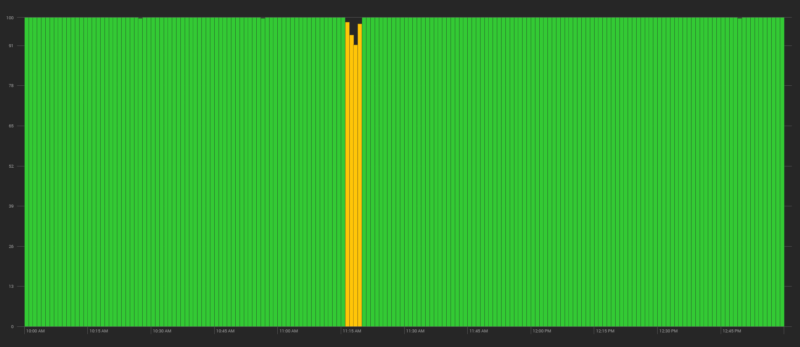
For 2016 we’ve set a goal of no more than 120 individual minutes of downtime and 360 minutes of degraded service. We arrived at these thresholds by looking at previous years and forecasting while also pushing ourselves to improve. Admittedly, the target could be quantified as a “nines” percentage. But counting minutes is more straightforward and easier to track than a target uptime of 99.977%.
By the Microservice
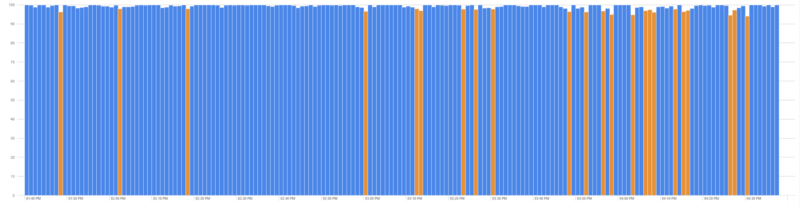
Hudl is split into smaller microservices, each serving a few pages and API endpoints. Along with the overall availability described above, we track it for each of these services independently to help identify contributors to availability issues. Regularly looking into how each performs lets us know where to focus on optimization or maintenance efforts.
Here’s an example of a service that performs inconsistently and needs some work:
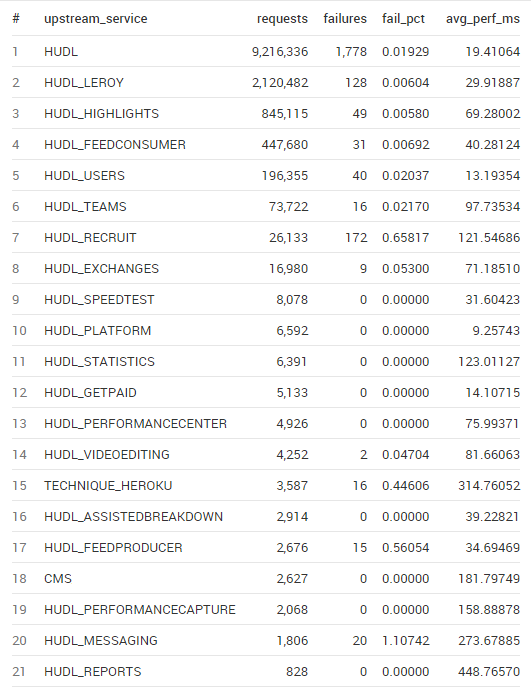
Stacking these metrics up side-by-side helps see the services that are higher volume and which services are performing relatively better or worse:
Shortcomings
There are a few things our algorithm doesn’t cover that are worth noting.
The argument could be made that 4XX HTTP responses should also be included as failed requests. We go back and forth on this — we’ve had server-side problems manifest as 404s before, but it’s tough to tell the difference between “good” and “bad” 404s. We’ve opted to exclude them for now.
It doesn’t cover front-end issues (e.g. bad JavaScript) since it’s solely a server-side measurement. We have some error tracking and monitoring for client code, but it’s a part of our system where our visibility is more limited.
The server-side nature of the monitoring also doesn’t cover regional issues like ISP troubles and errors with CDN POPs, which come up from time to time. These issues still affect our customers, and we do what we can to identify problems and help route around them, but it’s another visibility gap for us.
Never Perfect, Always Iterating
We’ve iterated on the algorithm several times over the years to make sure we hold ourselves accountable to our users. We have alerts on availability loss and investigate incidents prudently. If users are having a rough time and it’s not reflected in our availability, we change how we run the numbers. This is what works well for us today, but I expect it to change as we move forward with our systems and our business.