When, Where and How: Spray Charts for Baseball Hitting Analysis
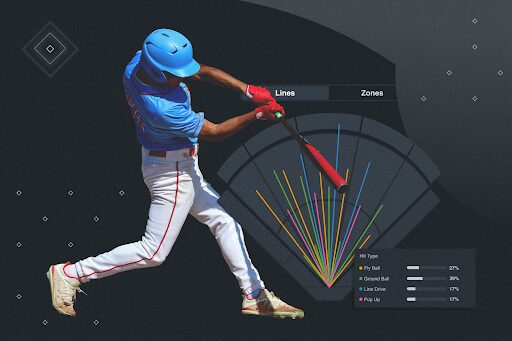
Baseball spray charts are useful for recording at-bats and illuminating hitting tendencies. By using baseball hitter charts or baseball hitting video analysis software, you can tell where the ball went during an at-bat. These types of tools are great for determining if a batter more often pulls the ball or hits the ball to the opposite field.
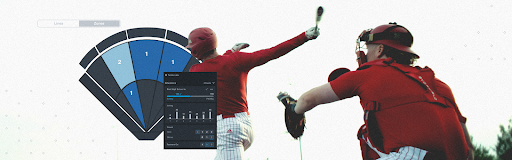
But relegating a baseball hitter chart to a piece of paper is exercising only a fraction of its ability. Hudl’s baseball hitting software, Hudl Assist, allows you to see beyond a pen and paper spray chart by connecting your game film with data.
Identify Tendencies
Baseball hitter charts are an excellent resource for identifying hitting tendencies. Whether you want to see where the ball is usually hit on outside pitches or how hard ground balls are hit when a fastball is thrown, this is your go-to resource.
For example, when you have access to Hudl’s interactive baseball spray chart, you can clearly see that the majority of your right-handed batters are pulling the ball to left field with runners on second and third early in the count. And with that info, you can go back to the practice field and have your team work on hitting the ball to the opposite field.
Self-Scout Your Own Team
Pen and paper hitting charts are now a thing of the past. Before, these types of charts were reliant on the human eye and an accurate account of where the ball landed during an at-bat. Instead of putting your faith into an assistant coach’s memory, turn to Hudl’s baseball hitting analysis software.
With Hudl’s baseball hitter charts, you’ll have an accurate account of where the ball went during an at-bat. You can then use that data to self-scout your own hitters and work with them to keep up their hitting trends or show them the pitches they should stop swinging at.
For example, if your seven through nine-hole hitters all tend to pop out to left field when faced with pitches on the outside corner, you can work with them to break that trend. In practice, you can have them work on hitting to the opposite field when faced with outside corner pitches.
Showcase Coachable Moments
Most baseball hitting apps are complicated and require a ton of extra work from coaches. Not with Hudl’s baseball hitter charts. Our spray charts make it easy to see how your team is performing at the plate–and with the help of Hudl Assist, it means no extra work for you. That’s a win-win scenario.
Along with identifying tendencies and self-scouting, Hudl’s hitting analysis software makes it easy to showcase coachable moments. Instead of just telling your team they’re pulling the ball too often or flying out to center field on 2-0 counts, now you can show them their form when they’re up at the plate. You can show them the data and work with them to be more patient at the plate, and take what the pitcher is giving them.
Baseball hitter charts have always been useful, but their evolution has turned them into one of the most important weapons in a baseball coach’s arsenal. And now it’s easier than ever to get these game-changing statistics and data. See what Hudl Assist can do for you.