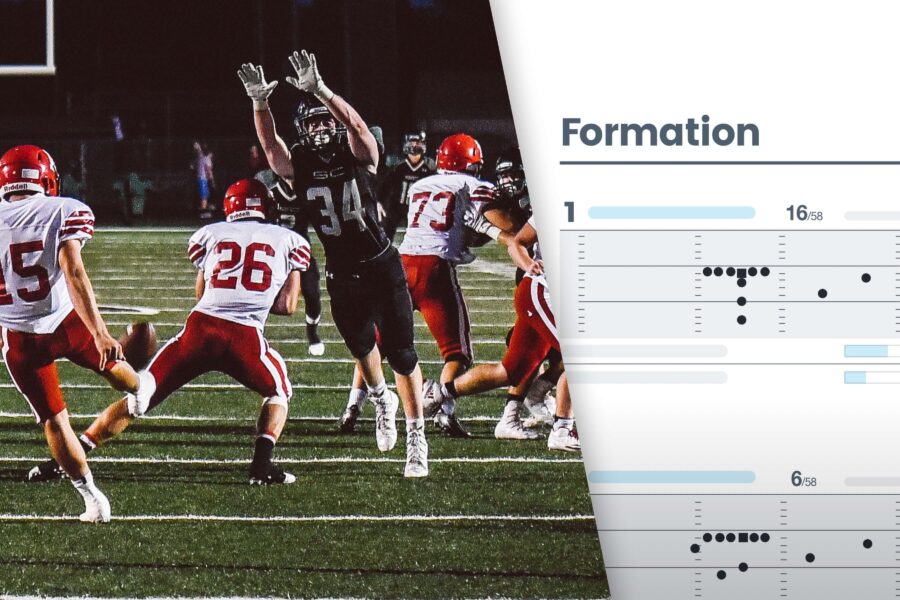
See how Hudl’s formation report can help you uncover opponent tendencies and create your game plan.
Five hundred coaches recently attended our online class to learn more about data and reports on Hudl. In this blog, we’ll take a closer look at a key aspect of that class—the formation report. Use it to confirm or deny assumptions about your upcoming opponent and create a plan of attack for the game.
Get Started with the Formation Report
This report is the most useful, and most used, report because of the valuable insight it provides of your opponent. Take a closer look at each formation to see what your opponent does. Do they run or pass more out of a specific formation? Uncover this and more with the formation report.
The basic data required to generate this report is ODK, gain/loss, play type, play direction, motion and result. From there, add the specifics with offensive formation and offensive play. If you want to take it to the next level, add backfield, strength, pass zone and gap.
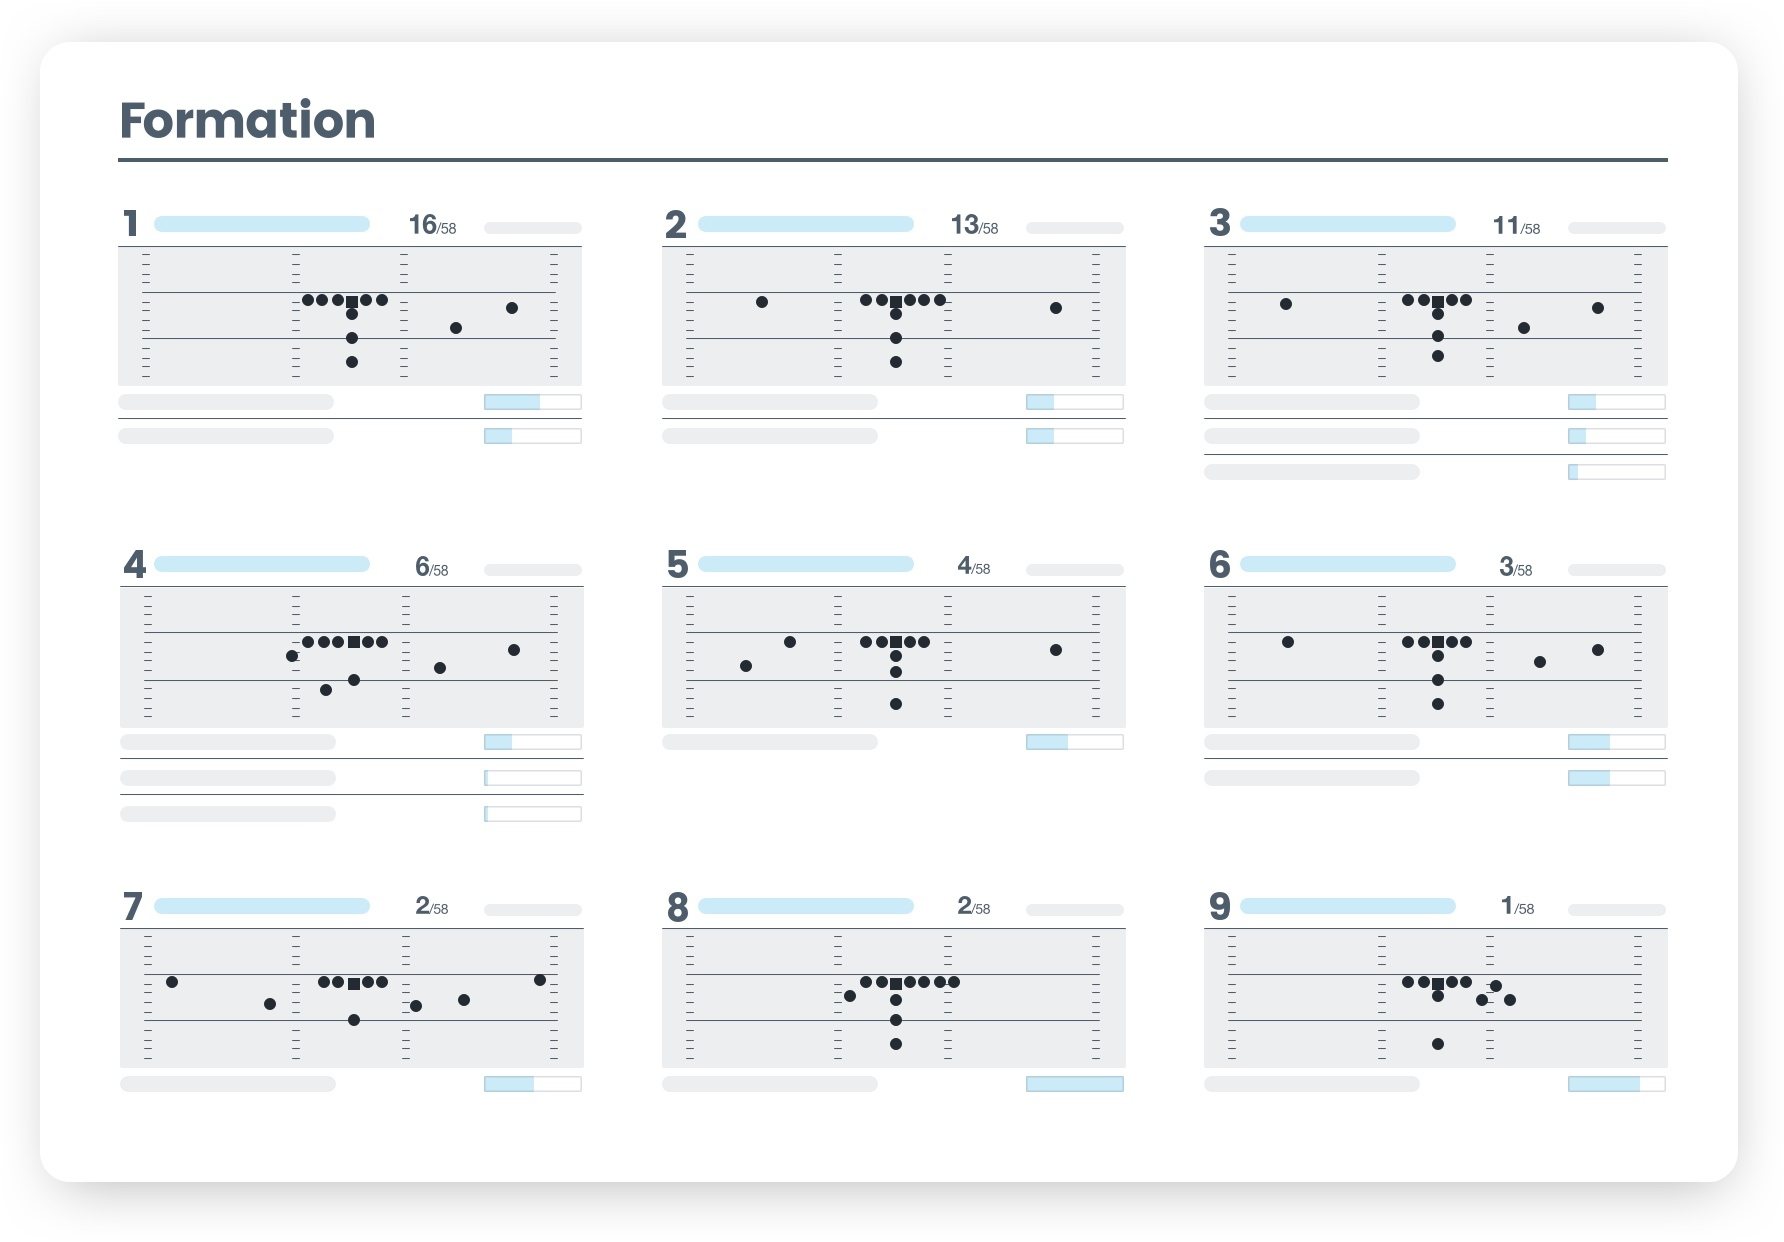
The report begins with a basic overview.
The nine most frequently used formations. Create formation diagrams for each to populate in future reports.
The top three plays in each formation shown with the total and percentage of each.
Run this report on single or multiple games. Have four scout games for your upcoming opponent? You can determine the tendencies and decisions your opponent makes across all of their games. Click any blue stat to see its linked video.
Go Deeper with the Data
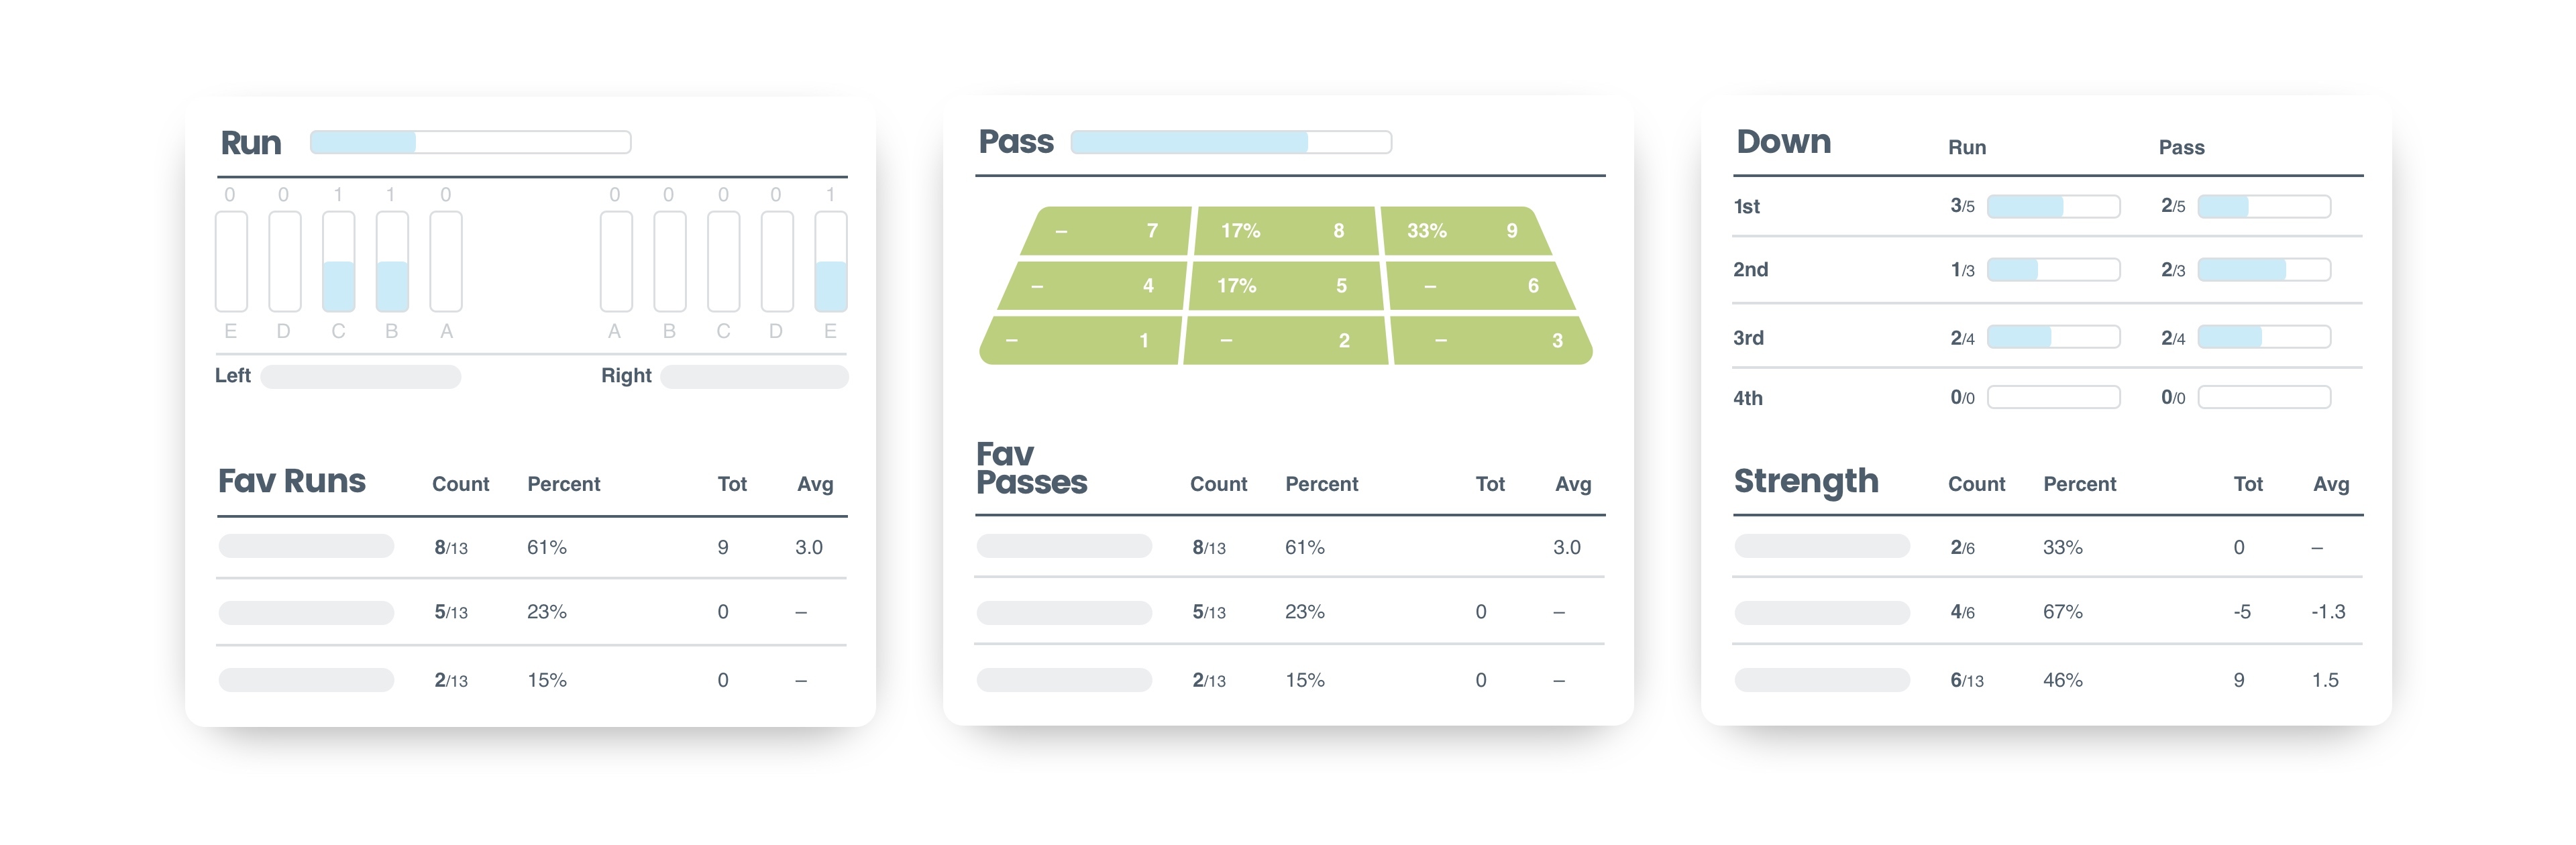
After the top nine formations, details on each formation in the game or playlist are generated.
Runs and favorite runs: Shows the total run plays out of the formation. It includes the total number of yards per play and an average of yards per carry—simply click the blue bar to watch all of the plays. If you added gap, offensive strength and play direction, you’ll see the how the ball was run through each gap and in which direction.
Passes and favorite passes: It’s the same idea here, but with passes. This section shows the number of passes from the specific formation, the pass plays, the percentage for each specific play and the total and average yards gained with that play. Tag pass zone in your breakdown data and you’ll see where your opponent throws the ball. Tag 1-3 for short passes, 4-6 for medium and 7-9 for long to get a percentage for each zone.
Down: Shows each down and the number of run and pass plays called. It also gives the percentage of runs or passes per down.
Strength and Motion: Shows how often the play is run to the strong side and breaks down which side is the strong side in a particular formation. If a play has motion, the report will show it in relation to both strength and play direction.
Backfield: Goes more in depth on the backfields run in the formation, how often they’re used and the run and pass percentage from that backfield.
Boundary/Field: Shows play direction by play type based on field location. For example, if the team is on the right hash, it will tell you how often they went to the wide side of the field or the short side.
Pro Tip: Enter backfield data in the backfield column, not the offensive formation column. The report can then generate all tendencies for each backfield in the formation—very useful information to pinpoint your opponent’s actions.
Tips from the Coaches
Once the data is tracked and your staff understands what’s included, incorporate it into your weekly routine. Use these first-hand tips for inspiration.
Use the formation report as the starting point. If you find any “tells,” run a custom report to confirm it's actually a tendency.
Have a formation alignment period at practice early in the week. Review alignment for your opponent’s top formations and any irregular formations you haven't seen in the past. Then focus on goal line formations.
The more data you enter, the more valuable the report will be. Start with the backfield, then add strength, pass zone and gap to go deeper.
If you label the backfield column on every offensive play, the formation report will show you the top plays in each backfield set for a specific formation. So if your opponent puts a running back to one side for specific plays, and only runs them when they’re aligned to that side, you can use that insight before the snap.
Use the report to see if a team has a heavy strong/weak or boundary/field tendency out of a specific formation. If they run the ball to the formation strength on 17/20 plays, work to shut down the run to the strong side.
If you have multiple scout videos for an upcoming opponent, select all the games and filter to offense in ODK. Save those clips as a separate All Off Plays playlist and run the formation report to get a high level view of the team. You can do the same thing with offense and first and second quarter clips to see the formations and plays to shut down early in the game.