Hudl Reports Provide Volleyball Coach Fresh Outlook on Stats
May 31, 2017
2 min Read
Thanks to Hudl’s Reports page, head volleyball coach Zoe Bell is able to drive team development by integrating video with data.
Volleyball and stats go hand in hand. Every match there are coaches on the bench tracking kills, blocks or digs. For some, those stats are enough. They can take that information, share it with their team, and move onto the next match.
Others are taking that data a step further. It’s great that your outside-hitter had 16 kills in a match, but what was their hitting percentage? How effective were they during the match? Linking those key statistical outputs to data can elevate your team.
Zoe Bell, head girls volleyball coach at Ardrey Kell High School (N.C.), uses the link between video and stats to see what led to the outcome, allowing Bell and her staff to make the necessary adjustments. “I can see every dig, and then it would show our defensive positioning. On the other hand, I can see every kill by the other team which could show us, maybe we weren’t in the right spots,” she said.
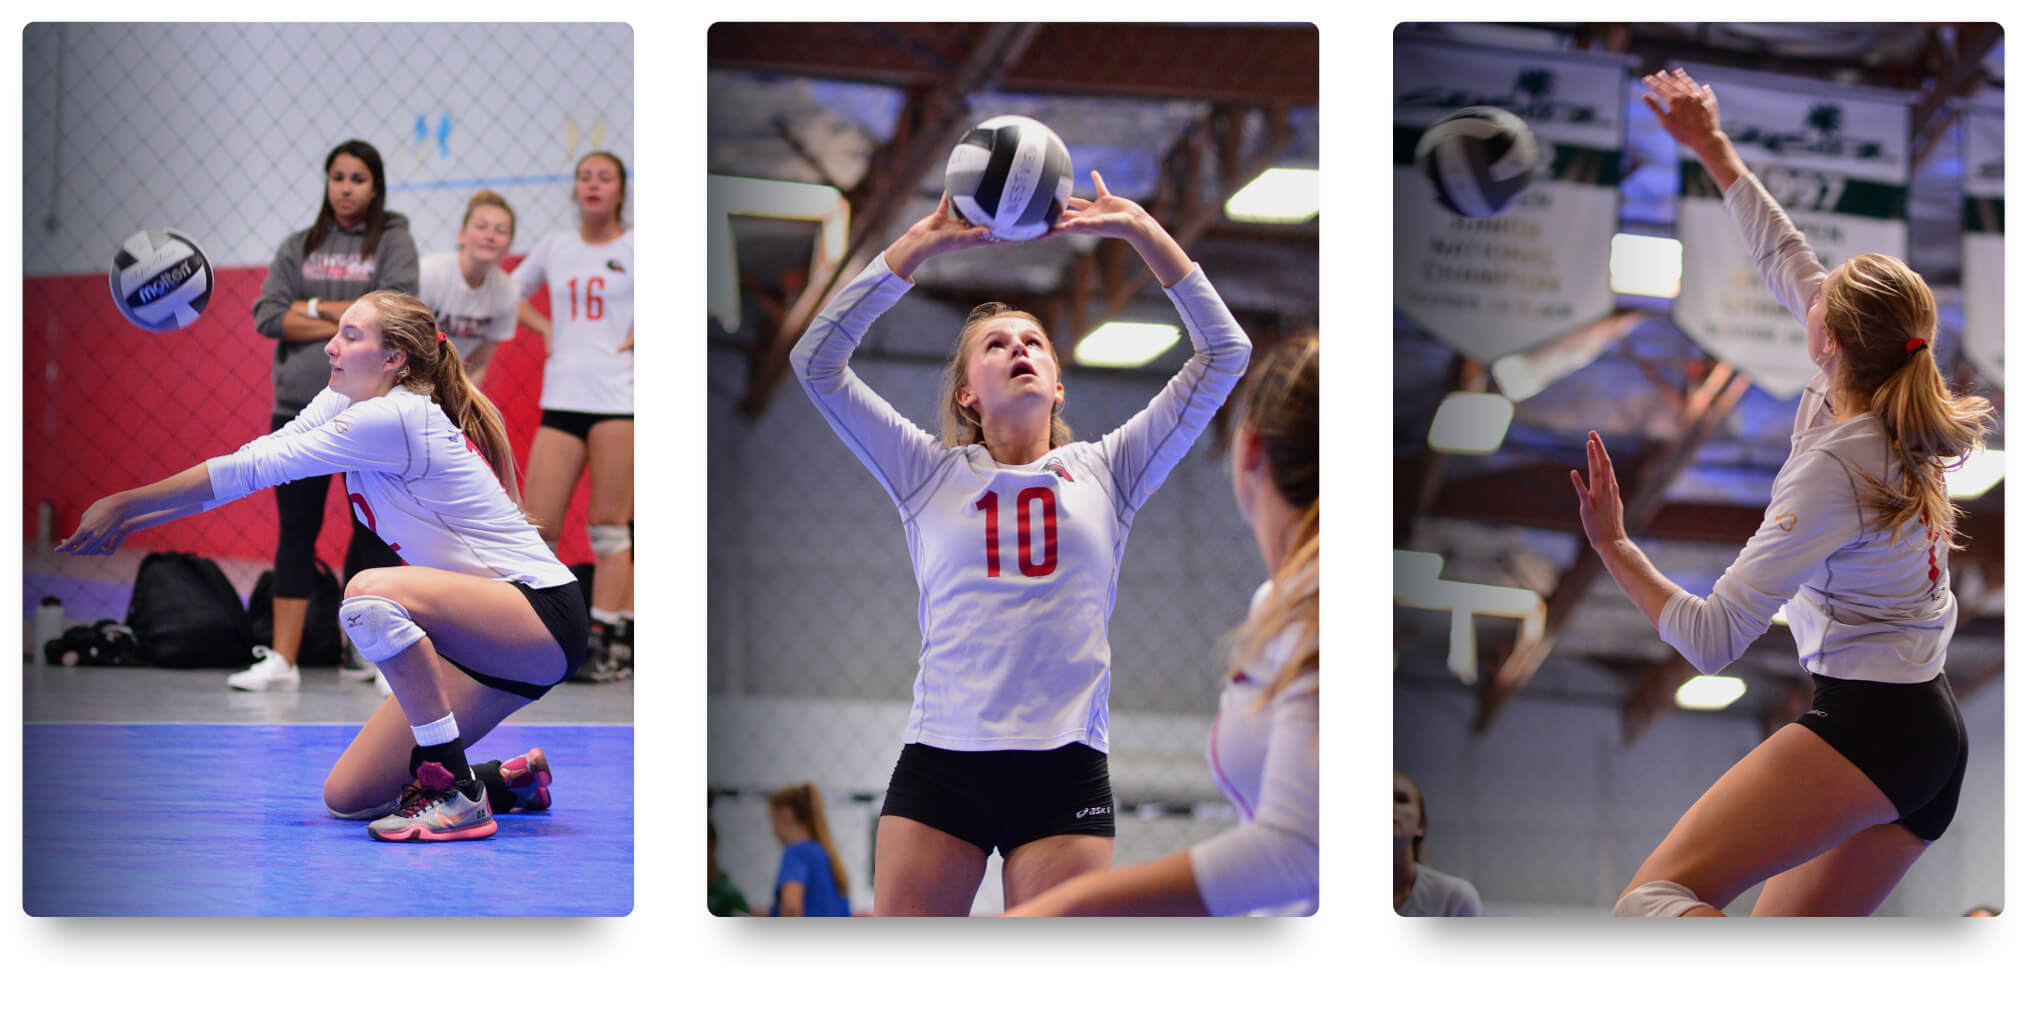
Hudl's reports page allows players and coaches to see their stats in action.
It also gives them the ability to use video to explain situations to their players. “You have kids that are verbal learners and some people that need to see it,” she said. “Maybe somebody’s hitting percentage is a lot better than somebody else’s, and then I can make that switch. Then visually I can show the girl, ‘This is why you’re playing time is not as much as it used to be.’”
The ability to see the video with the stat works both ways. It gives Bell the opportunity to teach, but it can give the athlete an avenue to express what they see during a match. That relationship is essential in building trust and opening lines of communication.
“If I have a kid coming in and I want to show them their hitting percentage was negative, we can go in and see what happened in that match,” Bell explained. “Maybe I didn’t transition out or maybe they were all bad sets.”
With data sorted into rotations, Bell can quickly identify what could be causing particular issues, and make adjustments on the fly. Even further, Bell can see the serving and hitting percentages for the rotations, the blocks and assisted blocks, as well as errors.
“Maybe I flip flop some people, maybe I switch my outside hitters, maybe it’s who I have side by side,” Bell said. “Maybe we’re not passing well in that rotation and that’s causing us to lose points and so maybe I have to change that. Or maybe if rotation three is our worst rotation I’ll start rotation four.”
With Hudl, Bell can use the reports page to see all of those outcomes, and help her team prepare for their next opponent. Join coaches like Bell in seeing what the power of stats can have on your team.