Stats That Tell the Story: How Hudl Assist Delivers Basketball Coaches Game-Defining Insights

Assists
The first stat that Coach David Armstrong looks at in Hudl Assist is, well, assists. Armstrong, the men's head coach at Alabama’s Baker High School, preaches ball movement, especially early in the season. “The first stat I was looking for today after I sent the game last night was our assist numbers,” said Armstrong. “I like to look at assists to field goals made. Last night we had 23 assists to 36 field goals made. That’s a pretty good indication the ball is getting shared.”
Hudl Assist also shows the assist-to-turnover ratio for each player, helping coaches identify who’s most effective with the ball in their hands. “I love the assist-to-turnover ratio,” said Commerce High School women’s head coach Kevin Furtado. “That’s the number one statistic for my guards.”
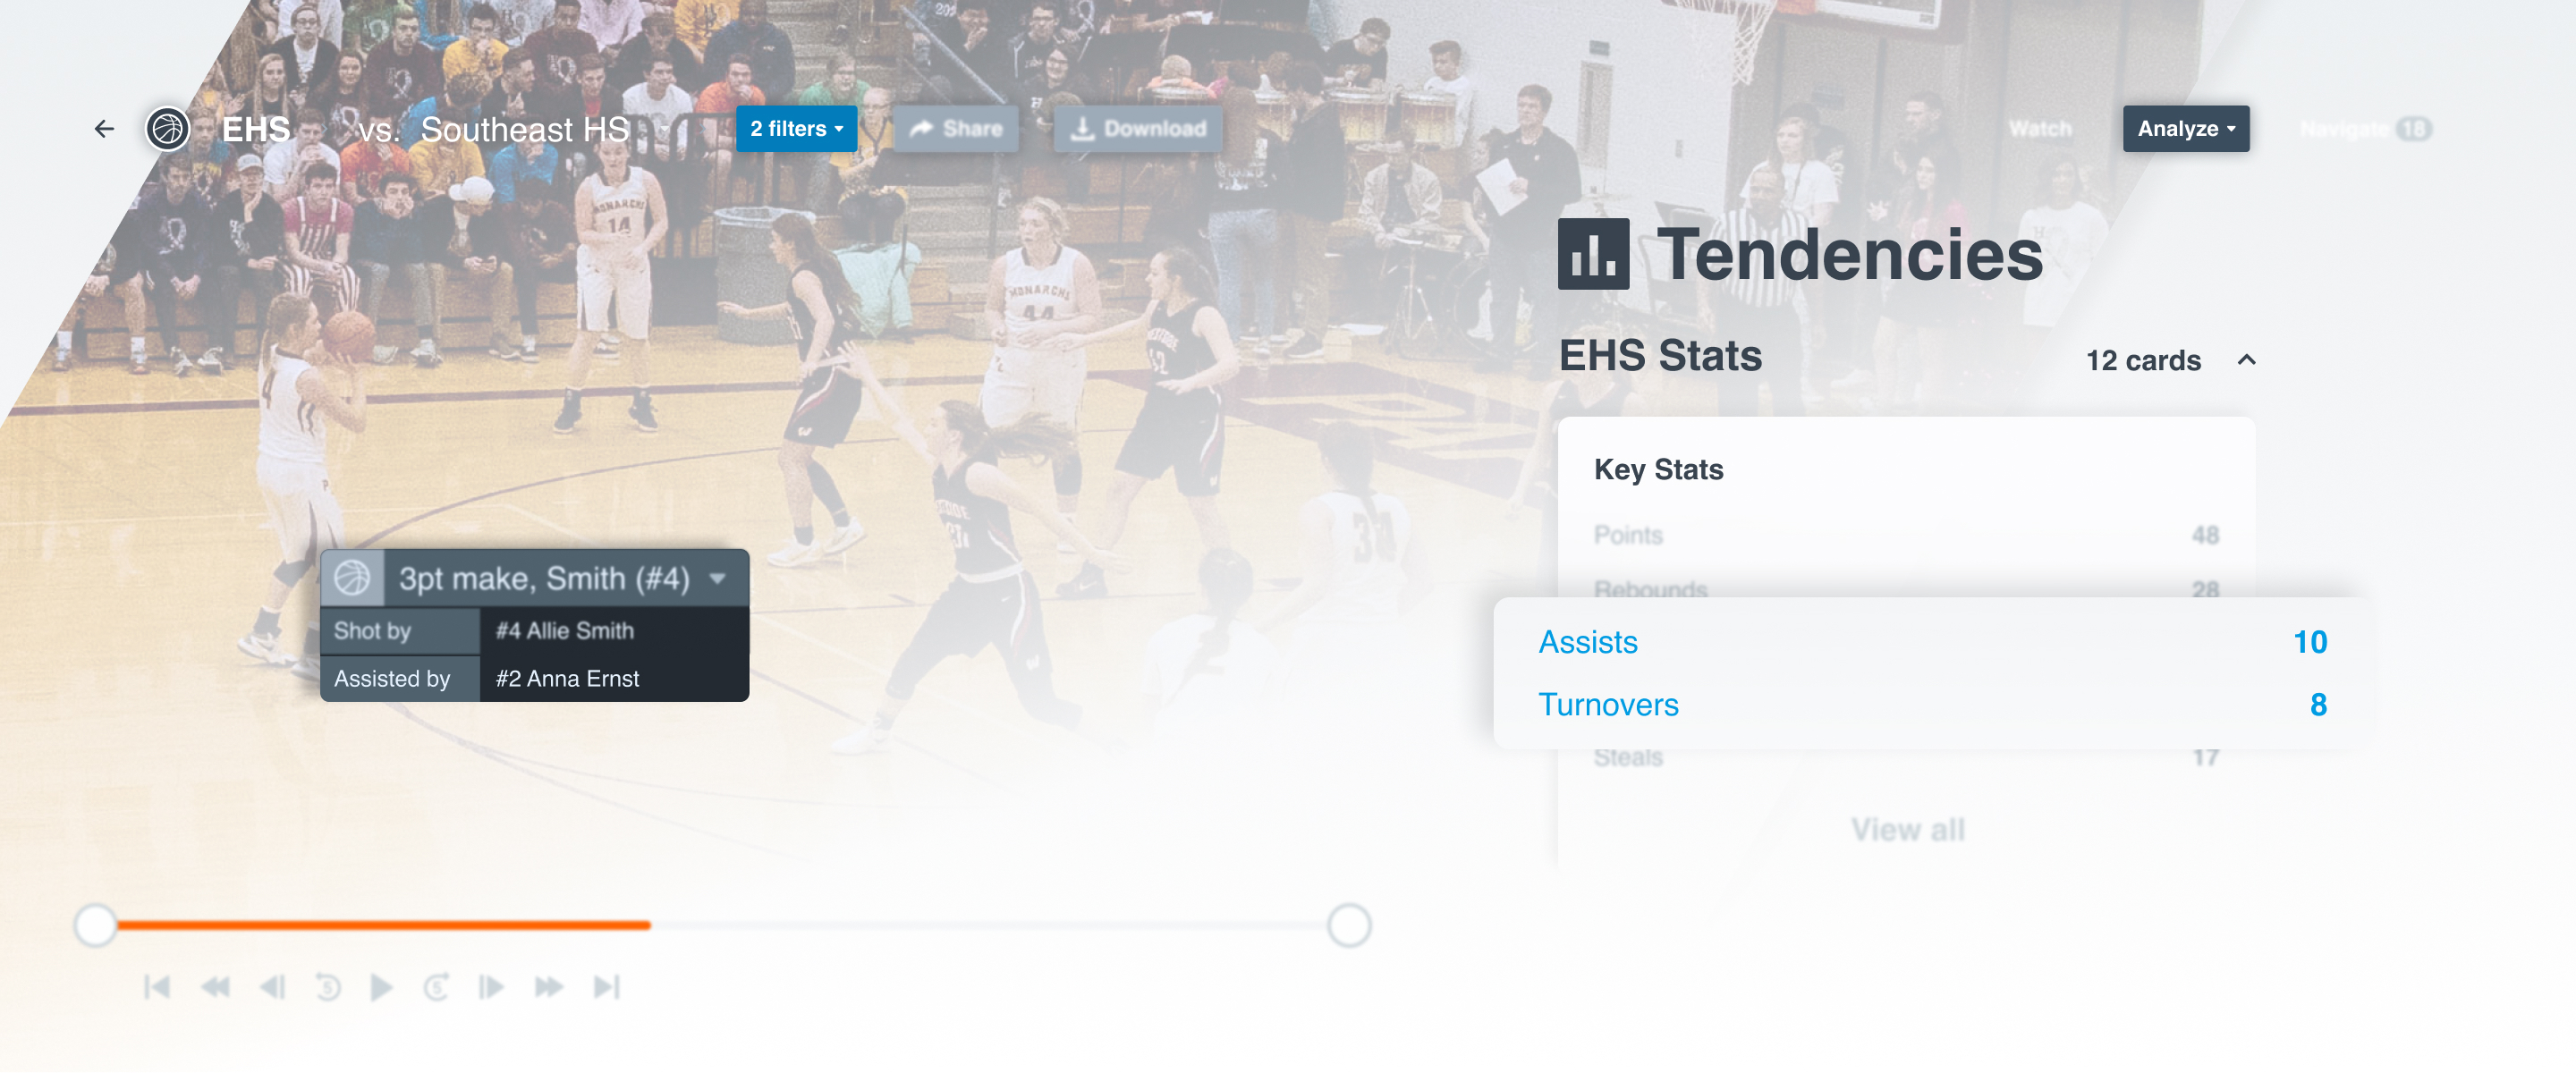
Turnovers
The first thing we’ll look at is turnovers, just to see if we won that battle,” said Brady Vossler, assistant women's coach at Lincoln Southeast High School. He uses the Goals feature in Assist to track his team's progress with specific benchmarks throughout the season. “We set a goal to be under 17 turnovers a game,” said Vossler. “If we can turn the ball over less than that, we have a good chance of not wasting possessions.”
For teams that push the ball and maximize their number of possessions, turnover percentage is a helpful Assist metric that better illustrates ball security. It calculates the percentage of possessions that end in a turnover, factoring pace into the equation.
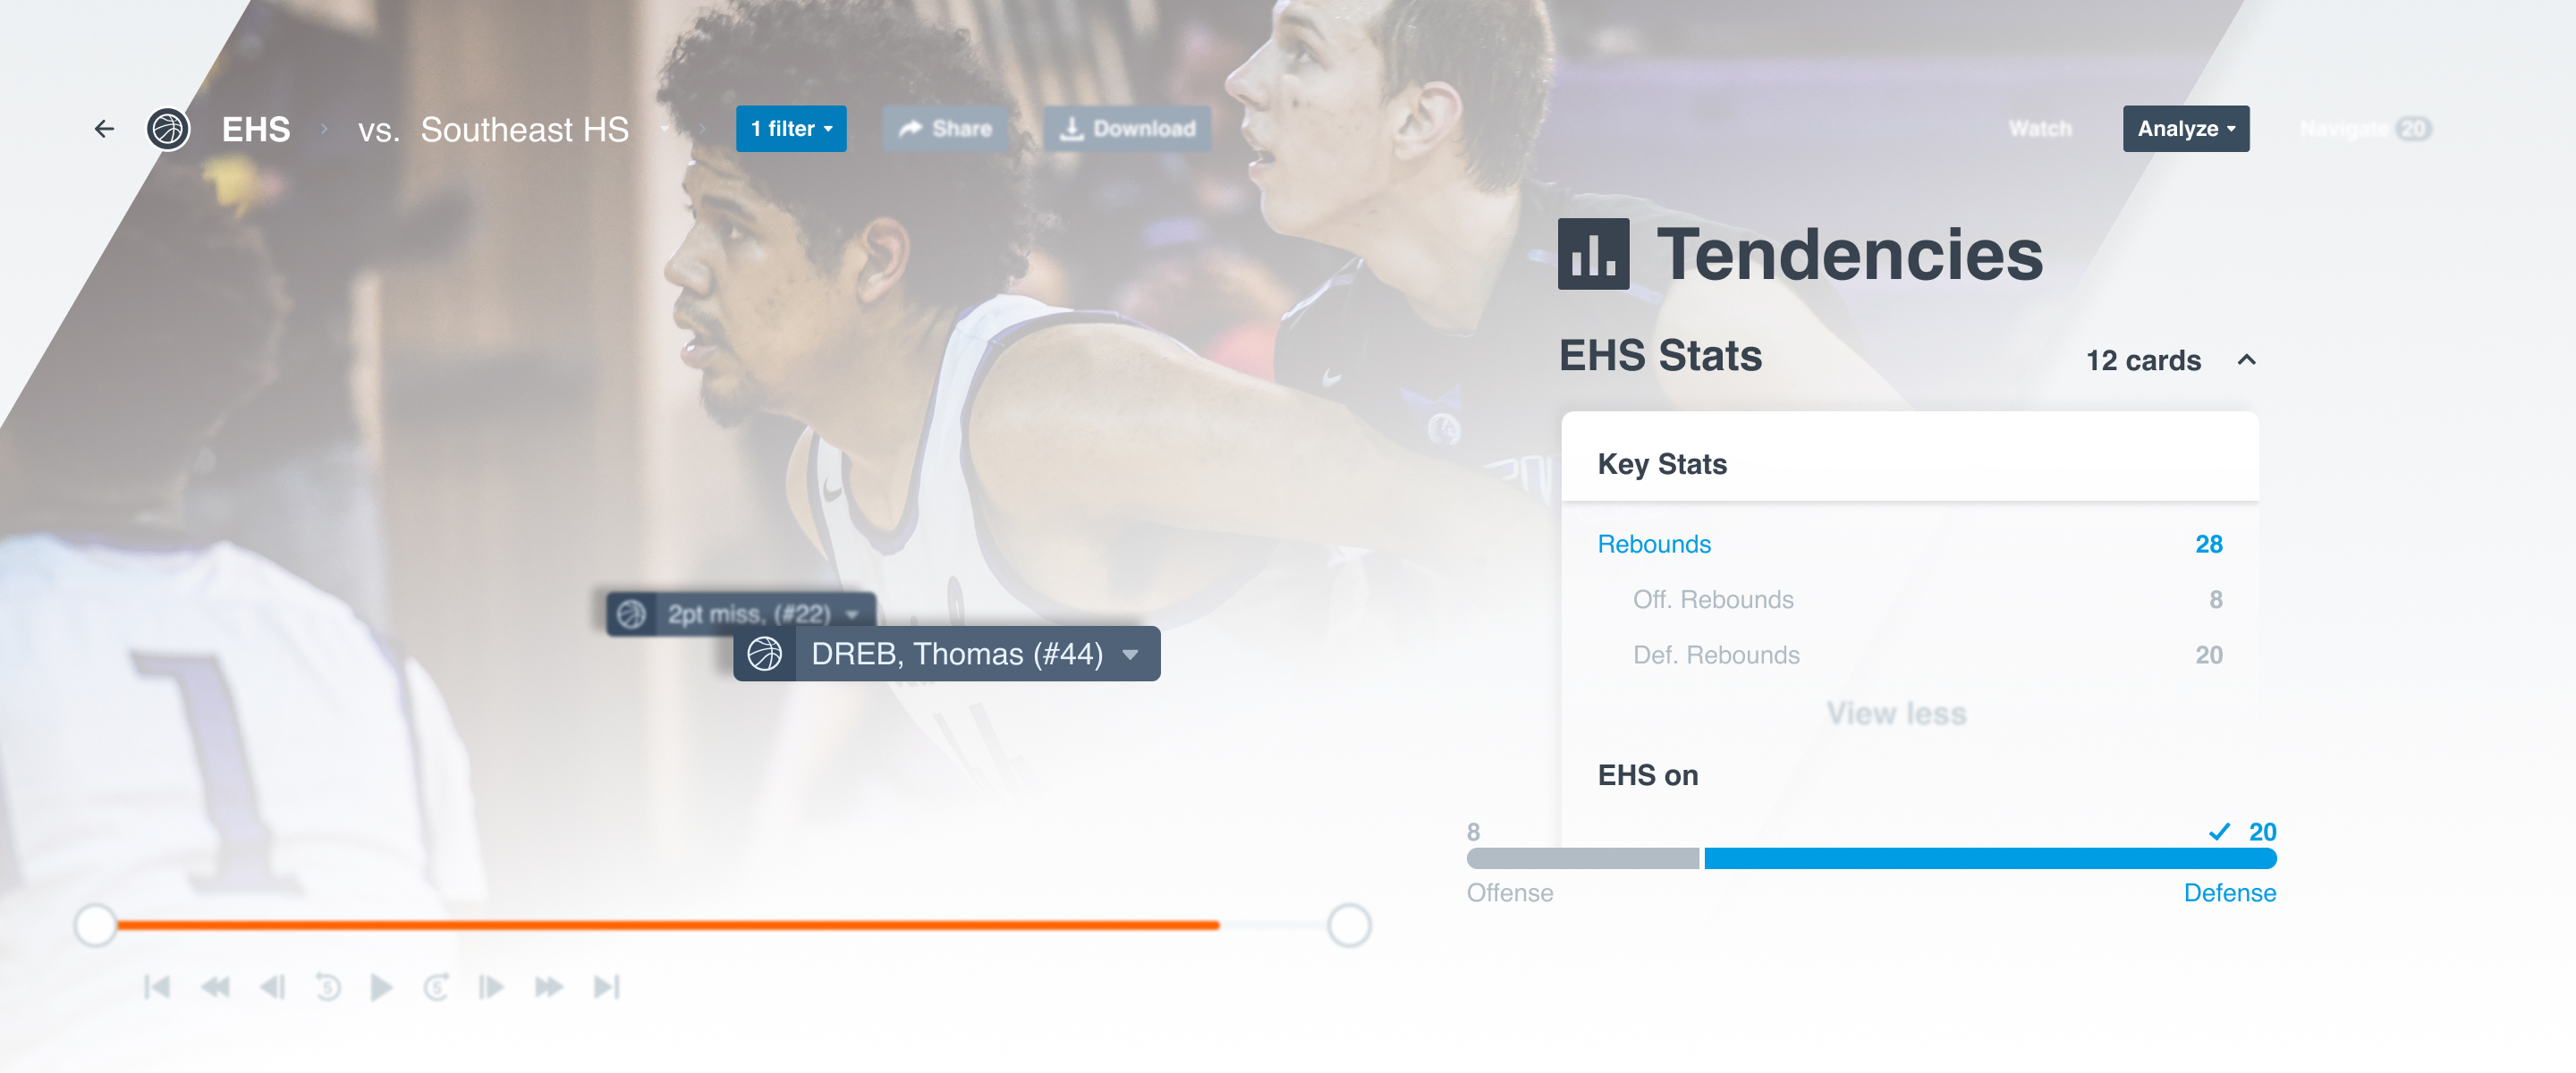
Rebounding Percentage
Though today’s game is largely perimeter-oriented, many coaches still believe games are won and lost in the paint. Count Archer High School men's head coach Antoine Stroud among them.
“We look at the rebounds first,” said Stroud. “That’s the first thing I look at, to see who outrebounded who that night. We talk about toughness a lot and rebounding is always a part of toughness for us.”
Rebounding the basketball goes beyond out-toughing the other team for Stroud. It plays a part role in outscoring them as well. “Most times if you win that battle, you’re going to win the game,” he added.
Armstrong agrees. “Defensively, I want to see what our defensive rebounding percentage is,” he said. “It’s a huge factor in whether or not you win a game.”
[Rebounds] are the first thing I look at, to see who outrebounded who that night. We talk about toughness a lot and rebounding is a part of toughness for us. Most times, if you win that battle, you're going to win the game.
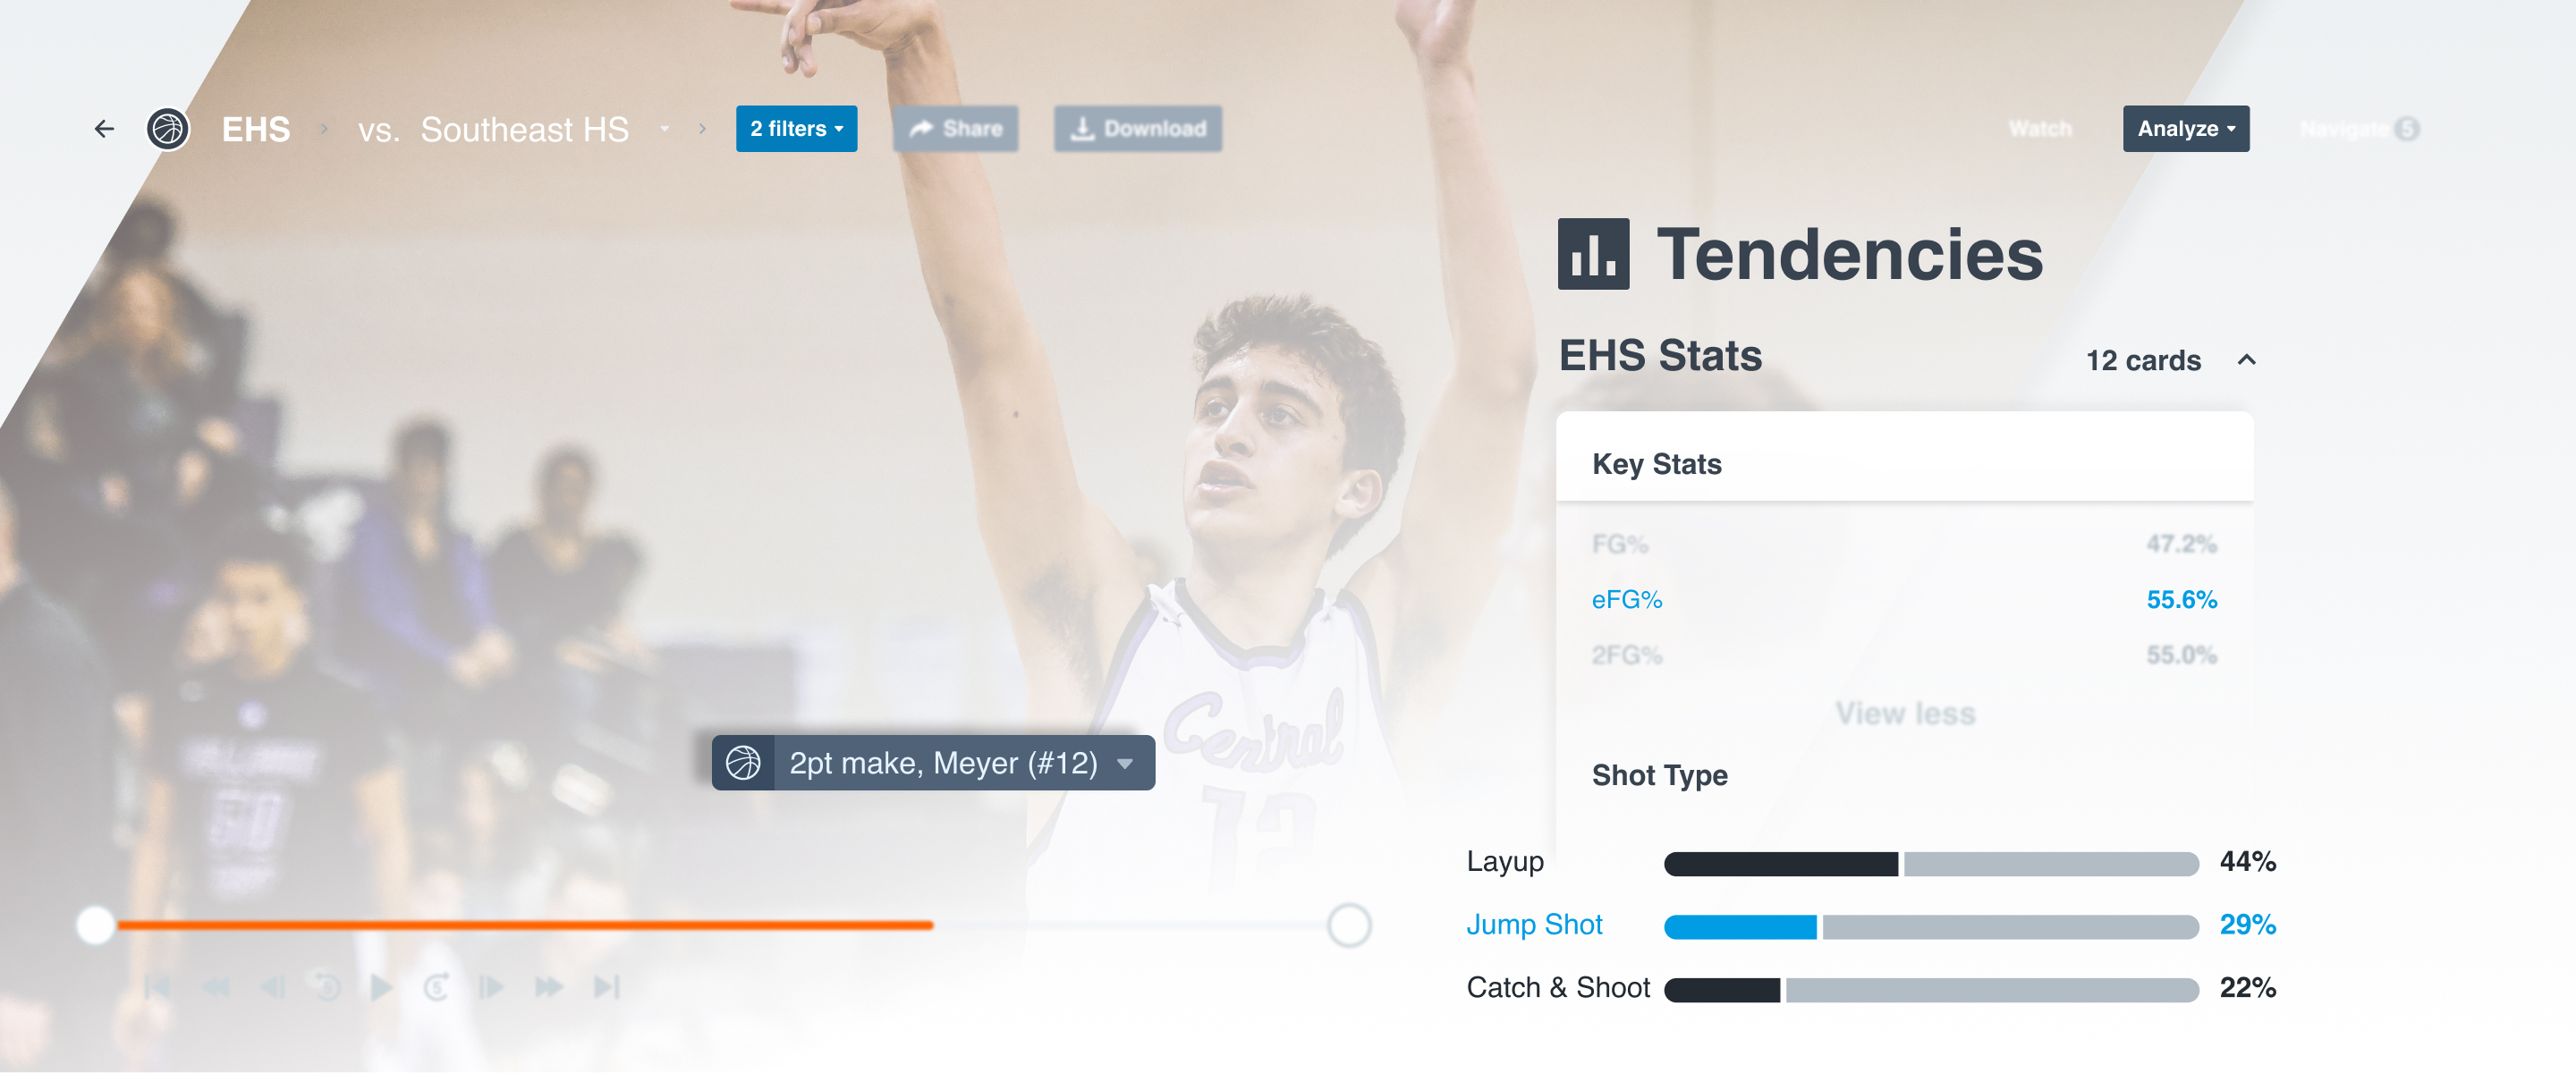
Effective Field Goal Percentage
With modern teams taking more three-point shots than ever, effective field goal percentage is the best indicator of shooting success. It gives made three-pointers extra weight, factoring in the additional point. Both Furtado and Stroud swear by this stat. “After rebounding, we look at effective field goal percentage,” said Stroud.
Furtado’s offensive approach makes this a perfect stat for him to monitor. “One of our objectives is to spread the floor with shooters,” he said. “We try to get the ball in the paint and then we try to get a kick out three to a spot-up shooter.” With all the extra threes they take, effective field goal percentage is the all-in-one stat to measure their shooting.
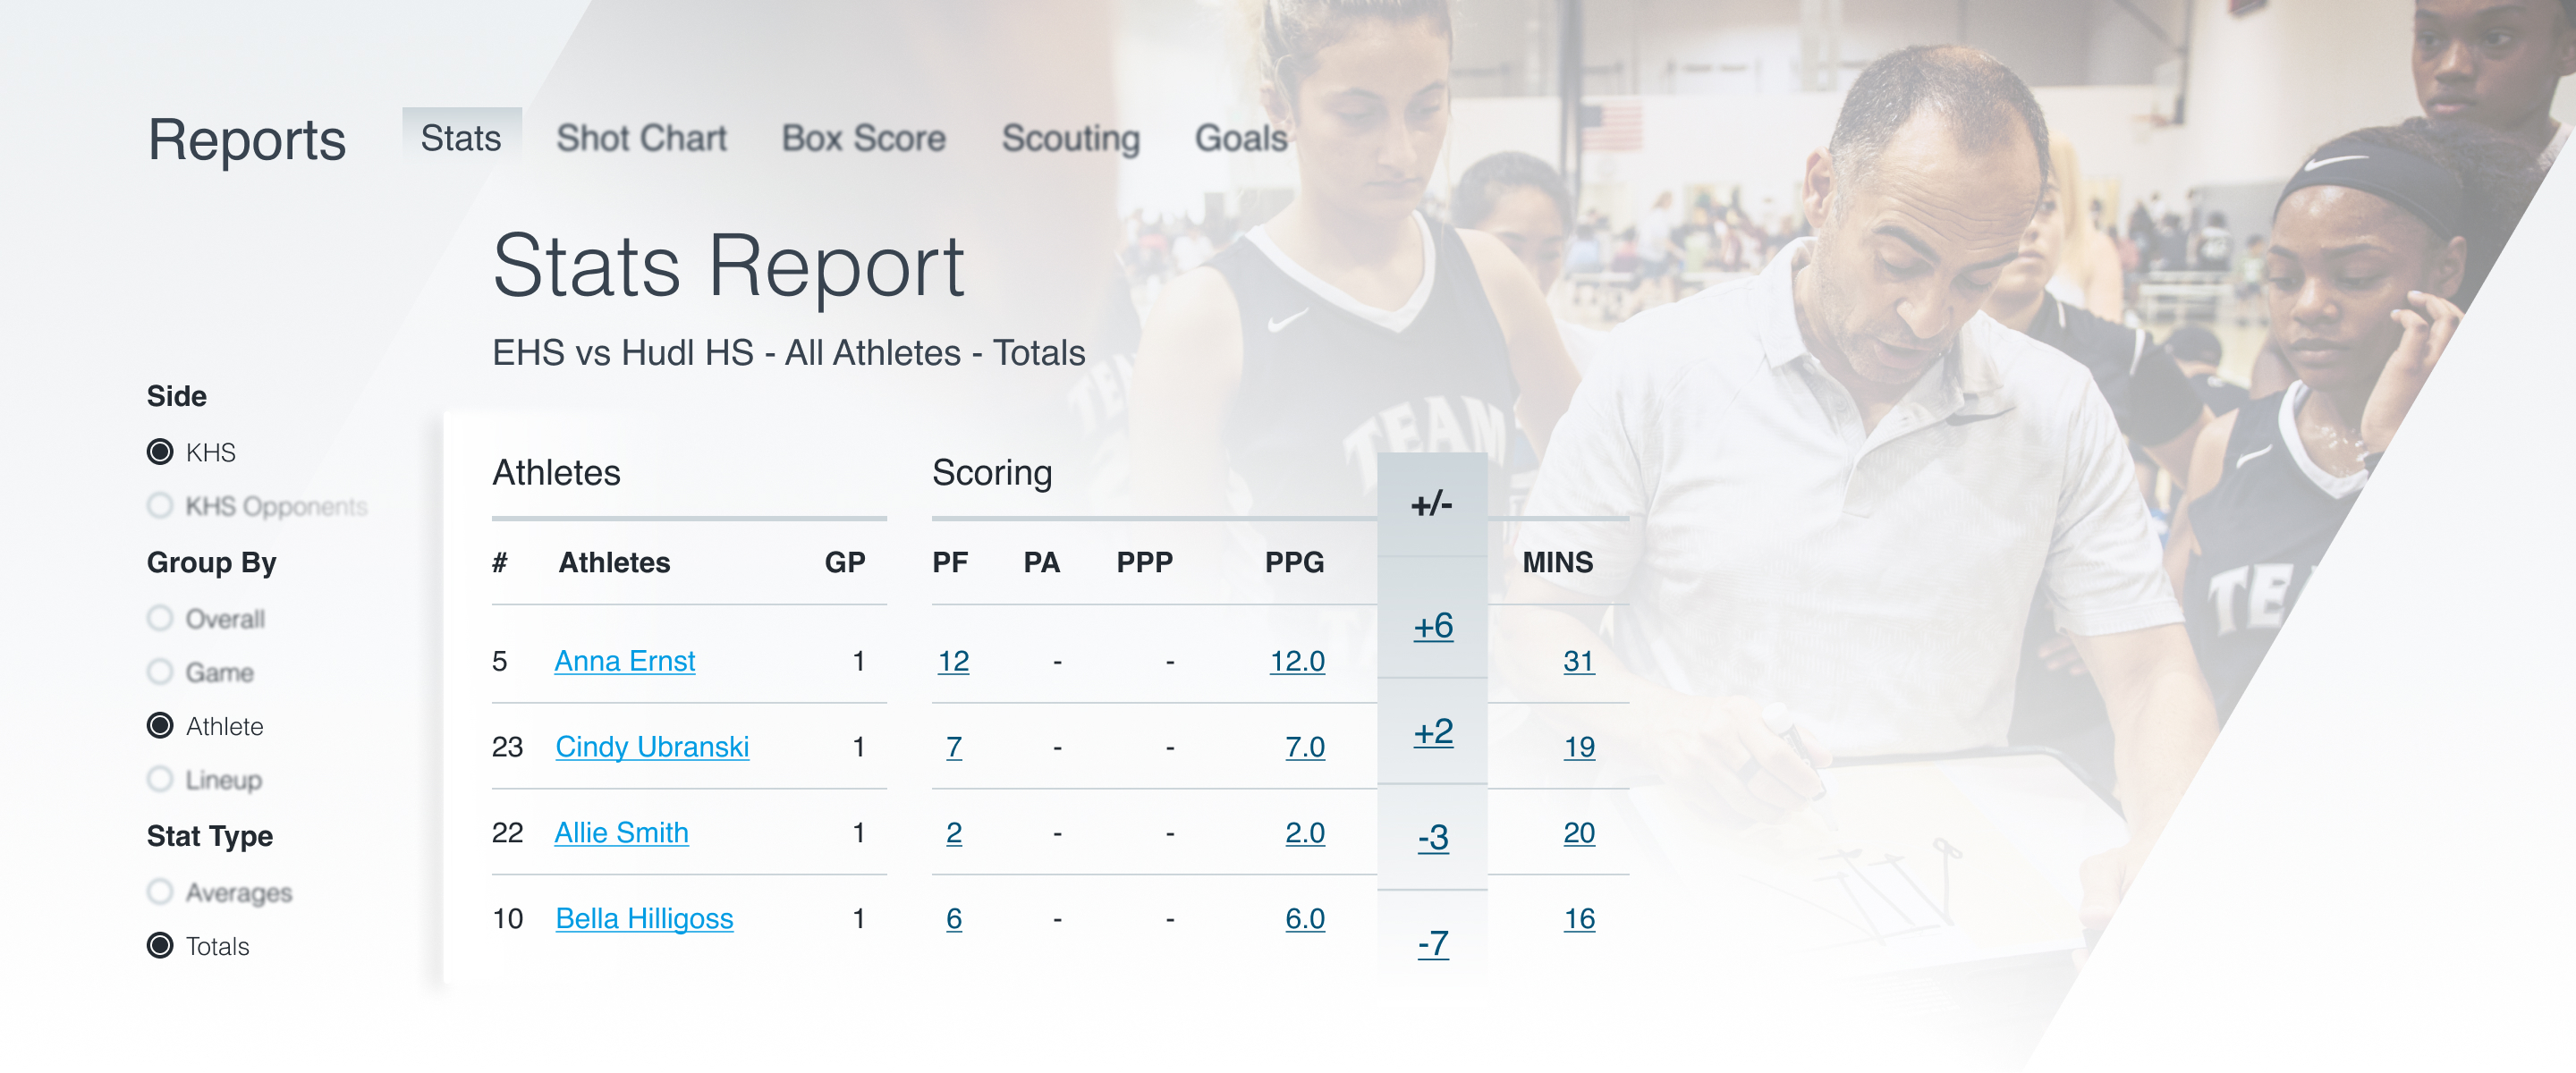
The plus-minus number is huge because you can say, look, he’s winning when he’s in the game. Why is that? Let’s see where he’s helping affect us.
Coaches that use Hudl Assist find another North Star number of equal importance—the hours saved that it brings to them and their staff. Plus-minus is such an important stat to Armstrong that he tried to track it on his own before Assist. Now, it’s delivered to him within a day—for every player and lineup combination that appears on the floor. “I love it,” he said of Assist. “I couldn’t live without it.”
Over 35 data points. In under 24 hours. Those are numbers that every coach should love.