
Our list of default reports is long, but it isn’t hard to find the five most popular.
Choosing Hudl as your video analysis tool is one thing. Using it to generate stats and reports is something else entirely. We don’t have to tell you that studying tendencies on both sides of the ball is a must, but what you might not know is how Hudl can give you that competitive edge.
As soon as the breakdown data for a given game is complete, you can generate a report in three easy steps:
- Check the box next to the playlist you want to run a report on.
- Find Report - it should appear right above your schedule entries.
- Select the report you'd like to generate and click Create Report.
And just like that, you’ll have all the details needed to prep for yet another opponent. Our list of default reports is long, but it isn’t hard to find the five most popular:
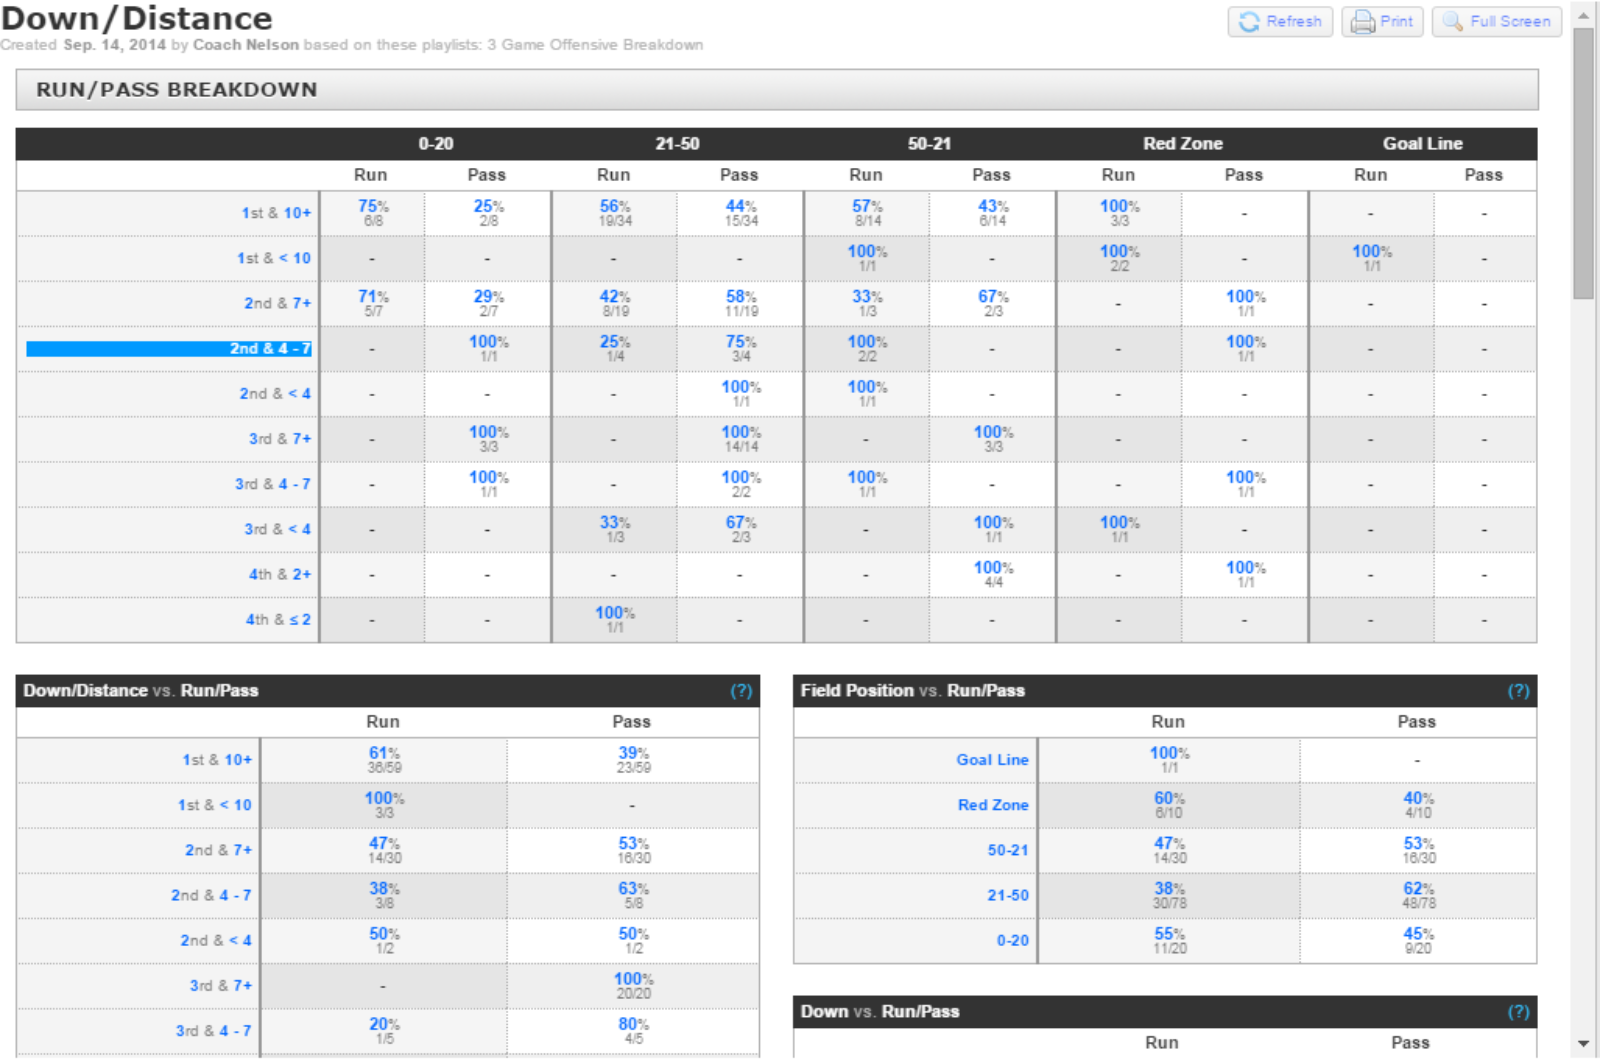
1. Summary Report
This is a basic snapshot of what your opponent does as a team. It’s a great cover page for your scouting reports with a solid run/pass breakdown, the opponent’s most-used formations, plus their three most successful run and pass plays.

2. Formation Report
Get the details on every formation your opponent may run. The first page of this report will show their top nine formations, but the rest of the report gives just as much data on every other formation they’ve used – even if it’s only been run once.


Most coaches use reports to scout opponents, but they’re just as helpful when it comes time to study your own tendencies. Analyzing your formations, field position, and most successful plays allows athletes to see what’s working or where to improve. It’s all a matter of seeing video and data together. After all, the numbers don’t lie.
We tried to cover all the basics with our pre-designed reports, but you can always customize your own to get everything you need and then some.
We know what you’re thinking – generating reports may be easy, but entering the data takes a ton of time. You can save hours of data entry by tracking stats live with Tag a Game, a free feature on the Hudl app for iOS. It completes 28 columns of breakdown data as the game is being played! From there, it only takes a few mouse clicks to sync with video.
If you have any questions or run into trouble, our support team is always an email away. Happy reporting!


