Sportscode Building Blocks: Scripting Heat Maps in Output Windows
Need better visual reports? Step up the quality of your Sportscode Elite output windows with heat maps.
Sportscode’s powerful scripting language allows users to generate compelling visual reports linked to video. Creating these reports is a common workflow for many successful users who have chosen to take advantage of Sportscode’s ability to display calculations from user-generated data.
Sportscode is the video analysis tool of choice for the world's most elite organizations, primarily because it is customizable to an extreme degree. That flexibility means choices for producing breakdown data or visual reports are only as limited as the user's imagination.
There are many great examples of visual formats used with Sportscode output windows (search #sportscode on Twitter and you’ll find some great real-life examples from users), including the effective use of images, color and other visual design techniques.
In this edition of Sportscode Building Blocks, we’ll use three key scripts to produce an interactive output report: BUTTON COLOR, BUTTON OPACITY and IF commands. We’ll then use those commands to create a heat map, a popular visualization in sports analytics.
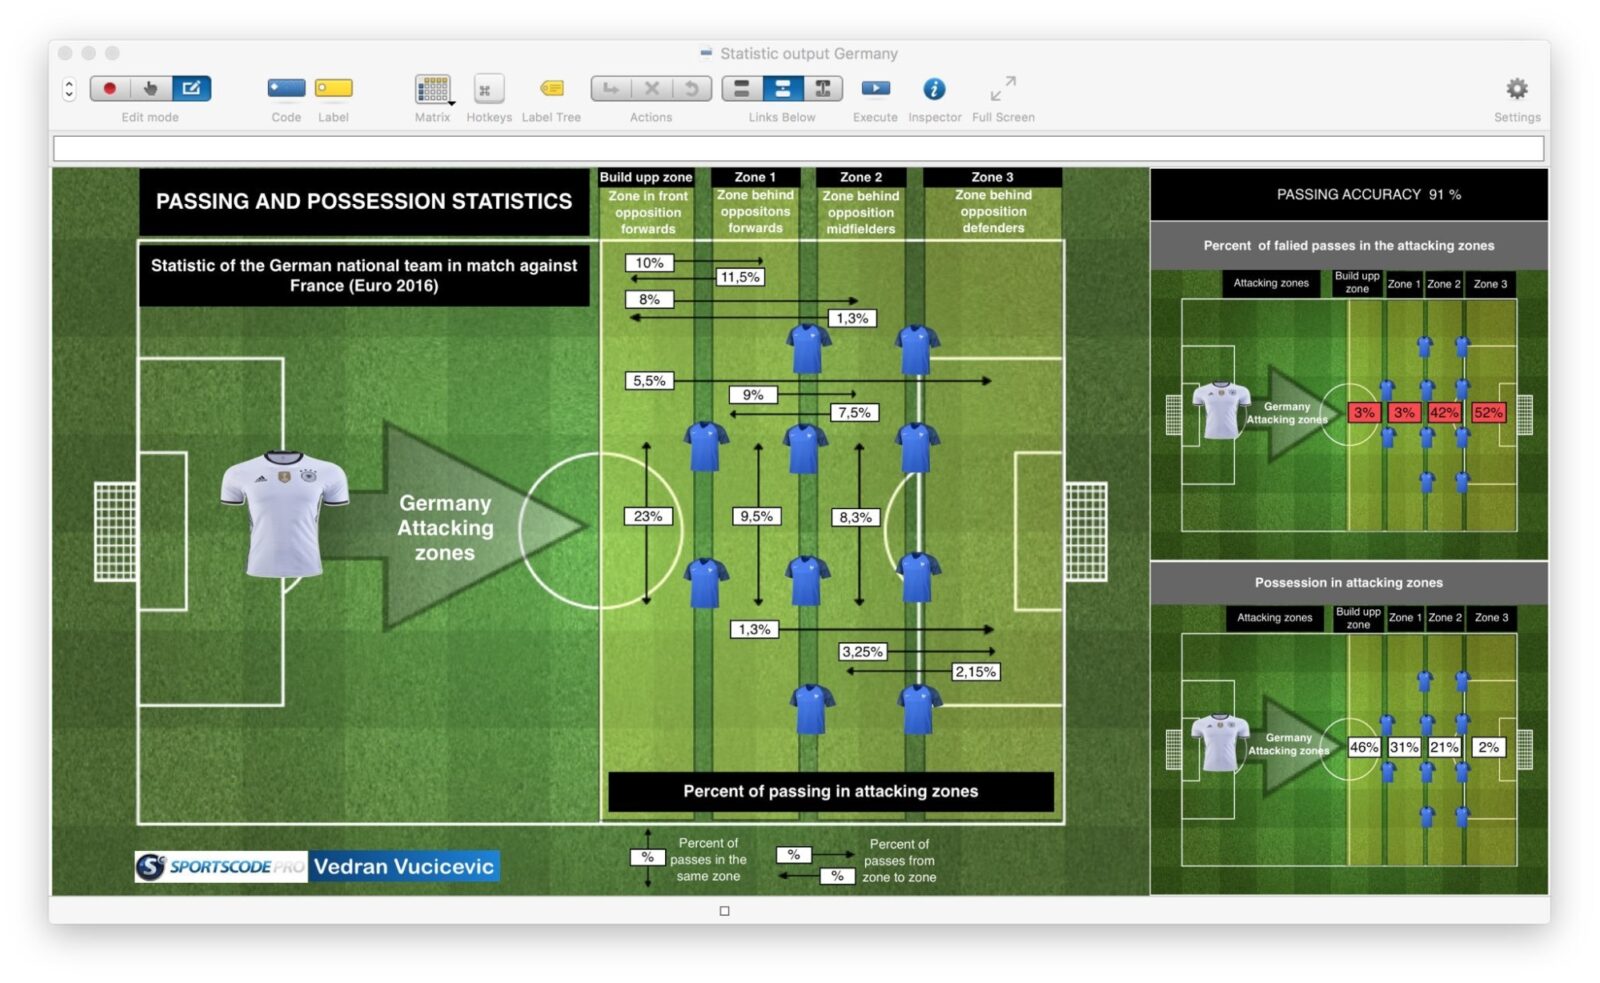
For this example, we’ll use shot location data in a football match and conditional formatting to create a heat map in an output window.
Quick Script Overview
BUTTON COLOR
To specify a button’s color in Sportscode, most often you’ll use the Appearance tab of the Inspector window. However, in the case where you’d like to use a command to change the color of the button based on data values, the button color script is the way to go.
The simple button color command is: BUTTON COLOR (0,0,0) where the three “0” are replaced with actual RGB color values.
Once the code window is in Report mode, the button will change to the specified color. The button command can be used alongside other commands (as we’ll see in our example) or by itself to simply change the button color.
There are many great resources on the internet for picking RGB colors, including these extensions for Google Chrome . Sportscode uses the 0-100 RGB scale, so when you settle on a color, make sure to convert it to that scale. If you find an RGB color on the 0-255 scale, multiply each value by .39 to get the 0-100 equivalent (rounding to the nearest whole number).
BUTTON OPACITY
With the BUTTON OPACITY command, a button will become transparent to the chosen degree, to allow layers beneath the button to show through.
Example: BUTTON OPACITY 75
The number following “BUTTON OPACITY” is essentially a percentage, so in the example above, the opacity is 75% of the normal effect.
IF
Conditional commands like IF tell the button to change color or opacity based on other values, like the results of other scripted calculations. The IF command requires a condition and an output to function.


