
Setting and tracking goals is paramount to a team’s success. Our in-depth reports make this process easier than ever before.
Possession-Based Metrics
Possession Percentage
This is the amount of time during a match that your team has possession of the ball. Based on your team’s style of play and the way your opponents line up, the amount of possession you want to have during the match will vary.
Goal to set: Possession above 50% game over game
Generally speaking, the team with a longer time of possession scores more goals and wins more games. That might not always be the case (see Atletico Madrid beating Barcelona in the Champions League semi-final last year), but it's a good principle to strive for if you play a possession-style game.
Attacking Transition
This stat looks at how many times your team regained possession of the ball when it was lost. It can give you insights into how your team counters when they win the ball and when paired with video from your matches, a closer look at how you won back possession.
Goal to set: Attacking transition less than 15.0
You’re going to lose the ball. It’s a part of the game, but you should aim to limit the amount of times it happens. The number is arbitrary, so set what you think suits your team best and track it. If you notice you’re losing possession fewer times than the number you set but you're still losing games, adjust that number and find out where you need to improve based on your video.

Goal Based Metrics
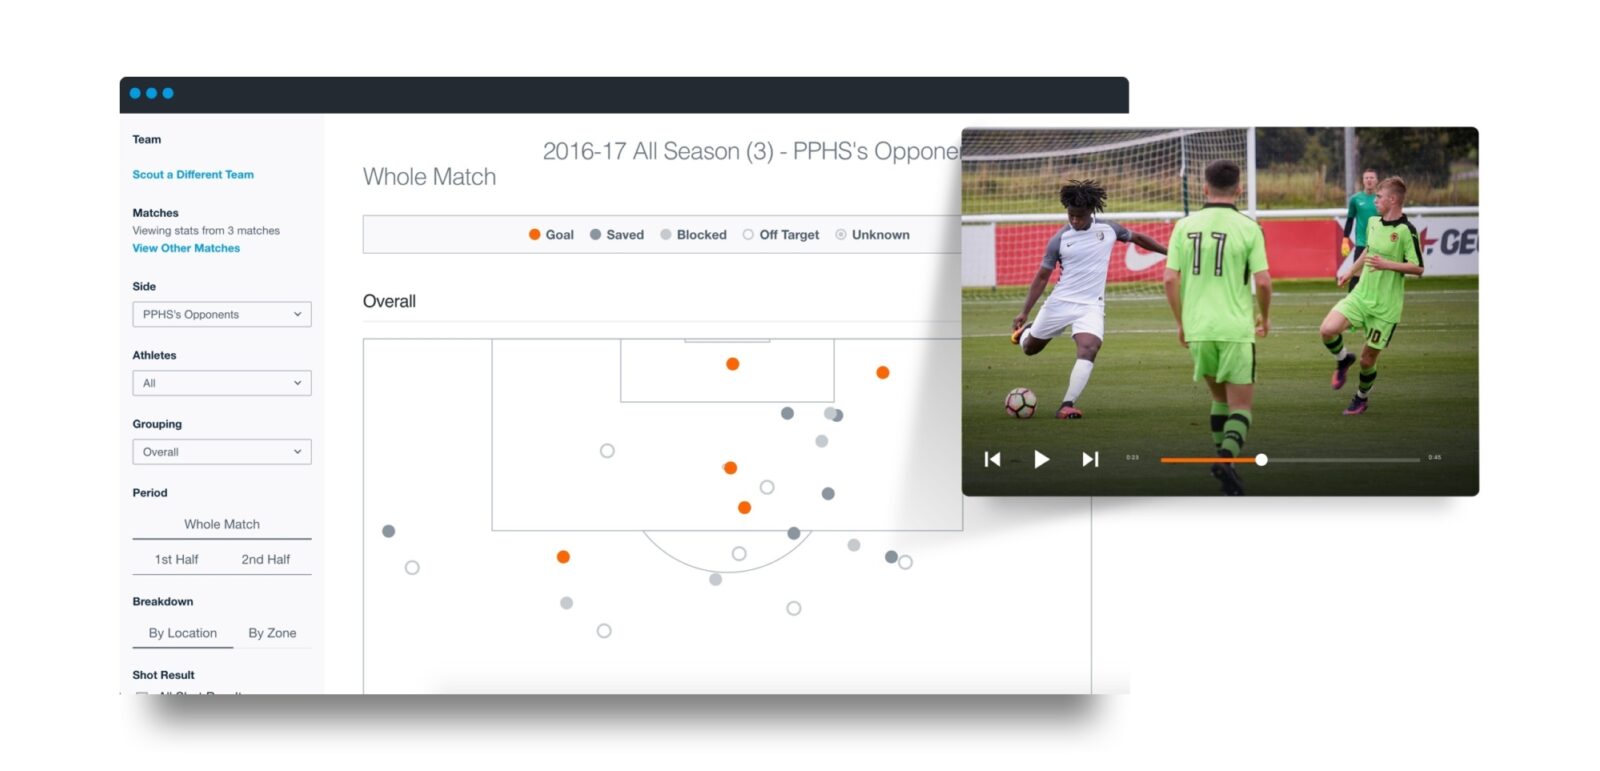
Shots to Goal
How many shots does it take you to score a goal? Shooting the ball just to shoot it usually doesn’t work. This stat will tell you how efficient your team is in shot attempts so you can help your players improve. It's automatically calculated by looking at your shots per game and the amount of goals you score.
Goal to set: Shot to goal < 5
Say you have 10 shots per game. If you’re scoring a goal every five shots, that results in two goals for your team each game. If you’re averaging two goals per game and limiting your opponents to less, that means more wins for your team. Find a reasonable expectation and pair that with your team’s goals per game to better gauge your success.
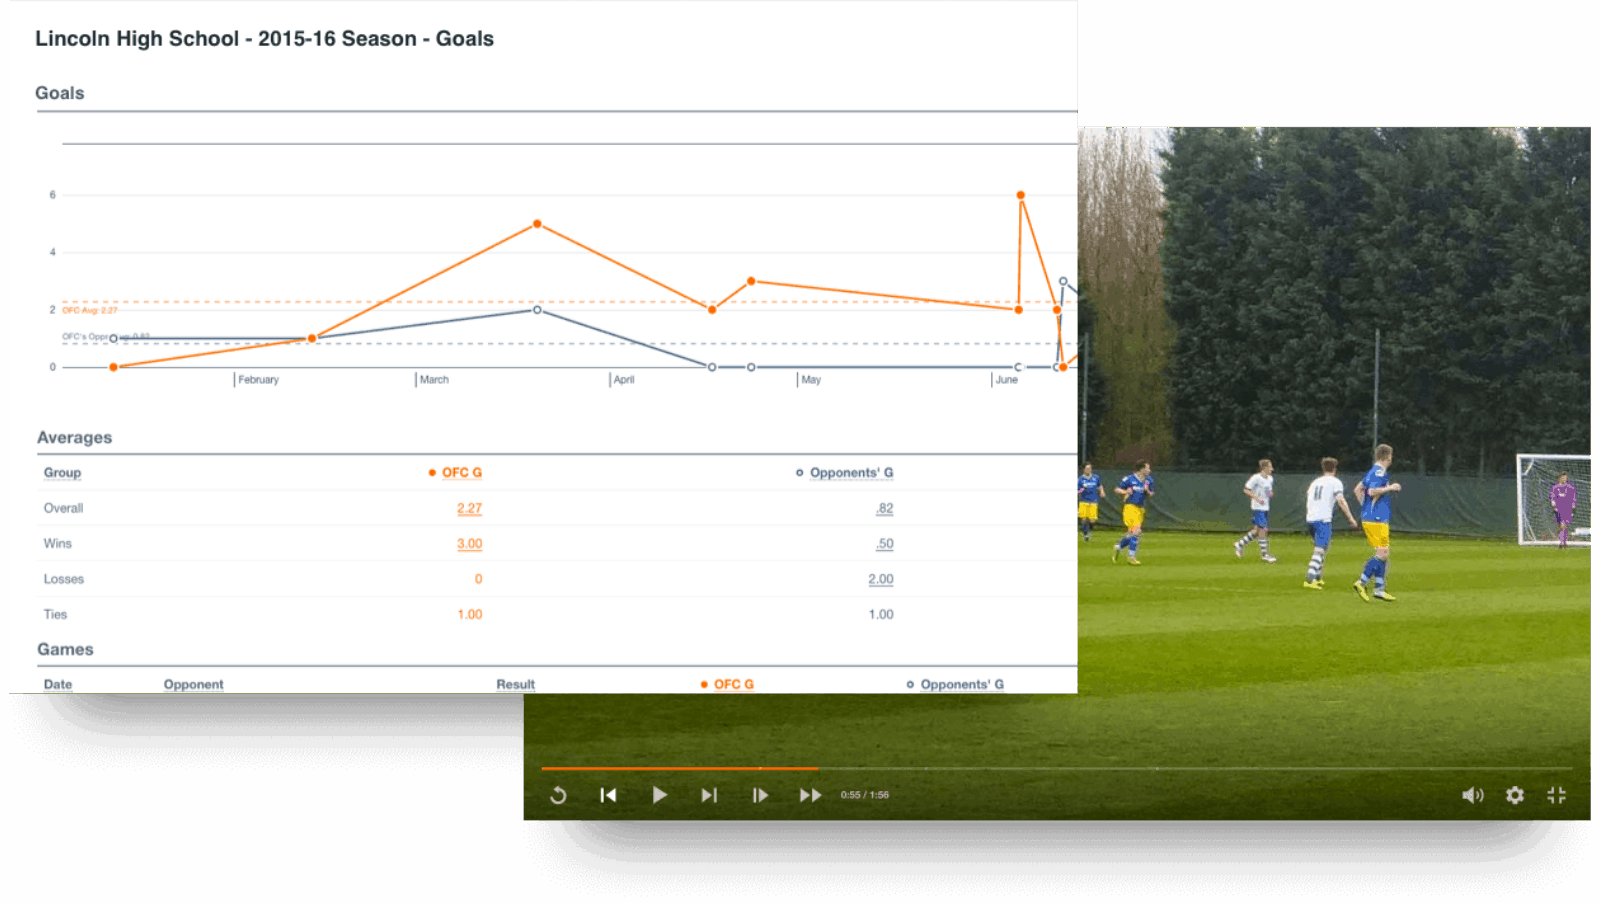
Goals per game
Every coach wants their team to score more goals—it's how you win. If you expect your high octane offensive attack to score more than three goals a game, hold your team to that expectation.
Goal to set: Goals per game > 2.3
This number is fairly arbitrary and should reflect your team’s goal output game over game. Some of Europe’s most prominent leagues see teams average less than 2.3 per game, but still finish at the top of the league (see Leicester City in 2015-16). In general, if you average around 2.5 goals per game, you’ll see more W's on your schedule.


